Productivity
Productivity, an explainer
Productivity is like pornography: we know it when we see it, but it defies clear definition. That doesn’t stop Taylor from making categorical statements about Australia’s productivity performance.
Economists assure us that productivity is important. Whatever their ideological disposition, few would disagree with Paul Krugman’s assertion:
Productivity isn't everything, but in the long run, it is almost everything. A country's ability to improve its standard of living over time depends almost entirely on its ability to raise its output per worker.
That seems to be clear enough, until we think about a long-standing argument between Americans and Europeans. As measured by GDP per worker, Americans are clearly more productive than Europeans. But are they really more productive: maybe they are just working harder, not smarter?
In fact, according to OECD data, Americans workers work 1800 hours a year, while Europeans put in far fewer hours. Norwegians, Danes and Swedes work only about 1400 hours, and as for the Germans, they manage only 1300 hours. (Arbeit macht nicht frei.) If we regard free time, time when we don’t have to work, as an “output”, we may regard Americans to be far less productive than Europeans, and somewhat less productive than Australians – we work about 1600 hours a year.
Variation in working hours is one reason why the prime indicator of productivity we use in Australia is GDP per hour worked, rather than GDP per worker. It is an indicator of labour productivity: when people, including Krugman, talk about “productivity”, they’re almost always referring to labour productivity, but there are other indicators such as capitalproductivity, which we’ll get to a little further on.
The trend in our labour productivity, over almost 50 years, is shown in the graph below.
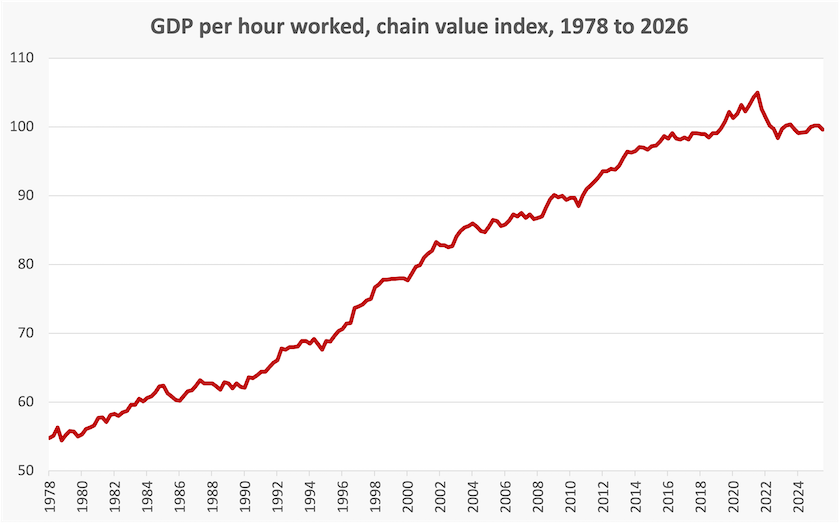
Over those same 48 years our GDP per hour worked has risen by 82 percent, while GDP per capita has risen by 108 percent. In rough terms, as our productivity doubled, our material living standards doubled, confirming Krugman’s generalization.
That’s the long term. But what has happened over the last ten years? The graph looks odd.
There was the Covid pandemic, which really messed with the indicator. That’s because hours worked dropped, while measured GDP was sustained by “Jobkeeper” and other programs. Therefore GDP per hour worked rose – an artefact of measurement.
When we consider the last ten years, however, looking through the Covid artefact, it is clear that productivity has almost stalled. This is partly explained by another factor: more of us are working. Over the last ten years our labour force participation rate has risen from 65 percent to 67 percent, and the unemployment rate has fallen from around 5.5 percent to 4.5 percent. This change shows up in productivity statistics in two ways.
First, when enterprises take on more labour, for many reasons the newer workers aren’t as productive as the already-employed workers. A stronger labour market pushes down our productivity indicator.
This issue has largely been ducked in our public discussion. The government generally sees lower unemployment as a positive, but we should ask how many people are working longer hours and multiple jobs because they have to, not because they want to.
Second, there has been a change in the occupational composition of our labour force. There has been strong growth in occupations for which productivity is hard to measure, particularly jobs in the care economy, which is largely government financed.
For these reasons we should be cautious about interpreting short-term movements in productivity indicators, and we should be aware that when we talk about “productivity” we’re generally referring to only one productivity indicator, labour productivity. Economists in government agencies, universities and consultancies are working on different ways to consider “productivity”. Read on, but you won’t find a simple definition.
There’s more than one “productivity” indicator
To come back to the basics, “productivity” is a hard-to-define idea. Developing a practical time series of productivity involves choosing some indicator of “input” that goes into the denominator and some indicator of “output” that goes into the numerator. Our main series – hours worked in the denominator and GDP in the numerator – has served us reasonably well – “good enough for government work”.
But that choice of denominator is only about labour productivity. It says nothing about how well we are using our physical capital or our natural resources. As a general rule, labour productivity rises when more capital is applied to a task – this was the economic driver of the industrial revolution and continues to be the main reason for rising labour productivity.
Economists have developed an indicator called “total factor productivity” that can quantify the separate contributions of labour and capital to changes in productivity. The Productivity Commission uses such a technique in its Annual Productivity Bulletin.
For example, if we were to make unwise capital investments – inland rail lines that go nowhere, nuclear power stations generating electricity we don’t need – the consequent damage to our economy would be because we’re wasting scarce resources, not because workers aren’t working smart enough. And although economists refer to total factor productivity, it isn’t really total, because it leaves out another crucial factor, natural resources. We have only haphazard indicators relating to the way we use scarce natural resources, such as the World Bank’s estimates of Carbon Intensity of GDP (kg of CO2 per $ of GDP).
For an economy-wide indicator there isn’t much choice other than GDP for the numerator, but we should remember what GDP does and doesn’t measure. If we burn more coal, GDP rises but if we use energy more efficiently GDP falls. If supermarkets become more profitable through exerting market power, GDP rises while if modular construction allows house prices to fall GDP falls.
Similarly GDP fails to cover unpaid work and non-market transactions. This point about non-market transactions is important when it comes to the public sector, because most of the output of government enterprises is not sold in market transactions.
There are other problems of measurement, revealed in recent publications.
Economy-wide measures mask productivity movements in specific sectors. The Productivity Commission looks at the productivity performance of specific industries and finds wide variations. Its latest Quarterly productivity bulletin, for example, finds that labour productivity has been particularly low in the electricity sector, bringing down the whole economy-wide indicator. But when it applies an estimate of multifactor productivity, this fall is explained by the large amount of capital investment in the electricity sector, which is yet to yield large benefits. It is possible that any sector undergoing significant capital transformation will show low labour productivity for a time.
We can go much further into the complexities of productivity, as John O’Mahony of Deloitte Access Economics does in a paper: Productivity and living standards are not everything: reassessing Krugman's maxim. He covers in detail the qualifications described above, and adds a third, the possibility that the relationship between productivity and material living standards is not one-way: “living standards, demand conditions, and macroeconomic policy also shape productivity outcomes”.
Ross Gittins summarizes O’Mahony’s paper in his Sydney Morning Herald article, The productivity obsession has a measurement problem, reproduced in Pearls and Irritations.
Productivity weaponized
All of these qualifications, however, haven’t stopped Angus Taylor from rushing in where more informed people tread with caution. In a speech to the Sydney Institute, he pours out his usual anti-Labor invective, asserting that productivity is “down nearly 5 percent” from when Labor got elected”. (Surely someone with Taylor’s education could think of something cleverer than the shyster’s post hoc ergo propter hoc sophistry.)
The essence of Taylor’s argument is that because much of the growth in GDP has been in the public sector – specifically in the care economy – it isn’t real growth. “Bigger government is making us poorer” is his main point. It’s the tired old Liberal Party line. Nothing produced in the public sector is real – it’s just wasted expenditure. Try telling that to a teacher in a public school, a nurse in a teaching hospital, a soldier, a CSIRO scientist, an air traffic controller, a police officer …
And he overlooks the most basic long-term driver of labour productivity, capital investment. In a two-minute clip, Alan Kohler explains that our poor productivity performance over the last six years follows a period of low corporate investment. He gives a pithy summary of our business culture – a dependence on commodity booms, and the phantom “wealth effect” of rising real-estate prices.
As for Taylor’s partisan comments, he may be more circumspect if his advisers show him what has happened to capital investment in Australia. The graph below, derived from basic National Account data, shows capital investment (“gross fixed capital formation”) as a share of GDP, going back to the 1960s.
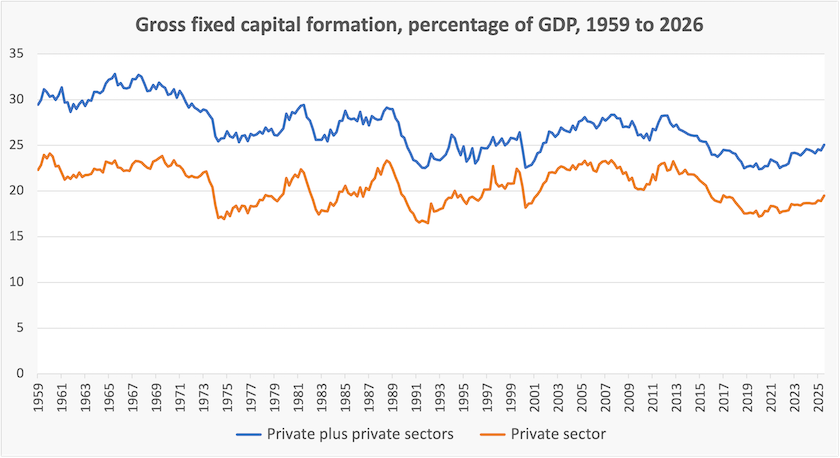
The most recent fall in capital investment was during the Coalition’s time in office, from 2013 to 2022. It was a time of political turmoil (three prime ministers in nine years), conflicting policies on climate change and our energy transformation, a wildly fluctuating currency, and the continuing distortion of the Howard government’s capital gains tax changes. Since 2022 there has been a recovery in capital investment.
That’s a warning to Taylor to be careful with his use of data.
The longer-term picture is one of a significant fall in capital investment from about 30 percent of GDP to 25 percent of GDP. It’s not just the private sector: over the same period public investment has fallen from around 8 percent of GDP to 5 percent of GDP. Neither of the parties that have been in government over this period can point to a strong record on capital investment.
Productivity and tax reform
The government’s tax reforms, in re-directing savings away from housing speculation and towards productive investment, should boost productivity.
As pointed out in the post above – indeed in most basic economic textbooks – the major driver of productivity is capital investment. Over the long term our deteriorating productivity performance has been associated with a fall in capital investment as a proportion of our GDP.
The government has just made significant changes to our capital gains provisions, basically undoing the changes the Howard government made in1999 and reverting to the previous system that taxed labour income and capital gains in the same way. If you pay any attention to the petulant wails of those who profited from Howard’s changes, to Taylor’s scare campaign, and to the uninformed statements of “wealth managers” and other influencers, you would think that the government’s changes – restrictions on negative gearing and reintroduction of indexation of capital gains – will bring the economy to its knees.
In fact the government’s reforms are specifically designed to encourage productive investment. Our savings should be going into real investment, rather than housing price speculation and fly-by-night speculative ventures on the stock exchange.
In his article Will property tax changes stem Australia’s productivity crisis? the ABC’s Ian Verrender describes how housing speculation developed its own dynamic, even before the Howard changes gave the process a boost:
… as interest rates began easing in the 1990s and real estate prices gathered pace, the banks discovered a perpetual motion money machine that would have made Charles Ponzi proud.
The more you lent, the more prices rose. The more prices rose, the more you lent and the bigger your profits. It was a great time to be a banker.
Then came the Howard era's halving of Keating's capital gains tax and the sails were set for the new millennium property boom.
As the title of his article suggests, the government’s reversion to the previous taxation system will encourage real investment, which, in turn, will drive productivity improvement.
Verrender’s article is mainly about housing. As has been pointed out in these roundups ever since the night of the budget, the government’s reforms actually lower capital gains taxes for long-term patient investment of all types – the sort of investment that slowly builds a nation’s productive capital stock.
Housing inflation has been one consequence of bad tax policy. Verrender describes another consequence of the property boom, a large increase in household debt, now almost twice household disposable income – concentrated among housing “investors” (i.e. subsidised speculators), and those who have been enticed into over-borrowing for their own homes. The relationship between house prices and household debt is illustrated in a pair of graphs in the Reserve Bank’s Chart Pack, reproduced below:
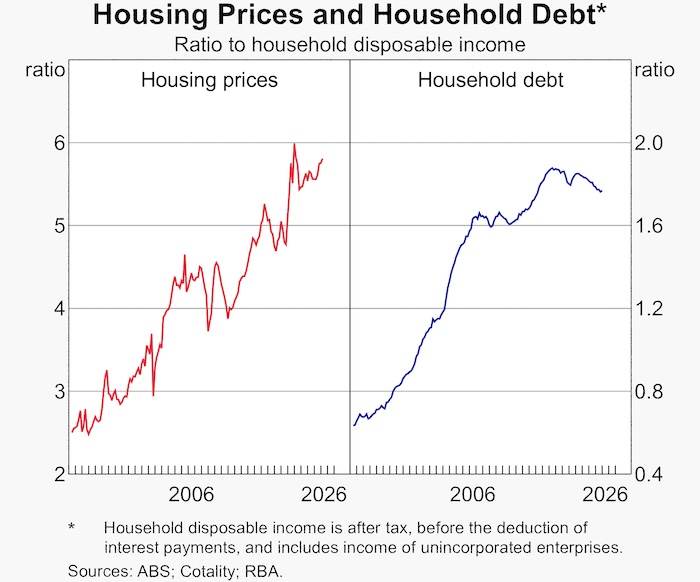
Verrender produces his own version of the chart on household debt, overlaid with similar charts for Canada, New Zealand, the UK and the US. We lead the pack.
This is the debt we should be concerned about, rather than our comparatively small public sector debt, covered in last week’s roundup.
Productivity – who benefits?
Improved productivity can boost real wages, but not if its benefits are diverted into monopoly profits and benefits for those drawing non-wage income.
Over the long run, if productivity doesn’t improve, real wages won’t improve.
But it’s a basic logical error to invert the syllogism and to assert that if productivity improves, wages will improve. Wages will improve only if the gains of productivity are distributed fairly, and that distribution should include wage-earners. But it is quite possible that the benefits of productivity will be absorbed by profits, or the incomes of non-wage earners.
Drawing on as-yet unpublished work by the Centre for Policy Development, Gareth Hutchens shows that Workers’ pay has not kept pace with productivity for 30 years.
The Productivity Commission has been arguing that apart from mining and agriculture there has been a close relation between productivity and wages. That makes some sense, because much of the “productivity” of those two industries relates to rates of resource extraction and international prices, rather than the usual drivers of productivity.
But the data Hutchens draws on suggests there has been widespread decoupling of wages and productivity in the rest of the economy, as revealed in most of 16 industries surveyed by the Centre for Policy Development. In sectors with high productivity gains, such as information media and communications, workers have shared few of the benefits, while in sectors with low productivity gains such as transport, workers have shared in the meagre pickings. Hutchens’ finding tends to confirm the fear that strong productivity improvement consequent on capital investment weakens the power of labour – a concern that is highly relevant as we deal with the uptake of artificial intelligence.
It can be argued that productivity gains in one sector boost real wages across the economy because of the benefits of lower prices in that sector. This has been the case in the information media and communication sector, but there has been a tremendous disruption to workers in that sector.
Hutchens’ findings align with evidence, linked in last week’s roundup, that while wages have not risen for ten years, Australians’ income has generally kept growing.
Politically it’s an important point, because it implies that workers are getting a poor deal compared with non-workers. There may be quite defensible explanations: an ageing population, for example, will require more of the benefits of economic growth to be directed to pensions. Or the explanation could lie in profit gouging, and in a tax system that privileges property speculators and wealthy retirees over wage workers.
So long as we go on talking about a “cost-of-living-crisis”, implying that we’re all doing it tough, we’re avoiding the much harder issue of looking at the structure of rewards in our economy – a structure that points to a worsening problem in unfairness and inequality.