Other economics
National debt scare campaigns
Scare campaigns about “national debt” are meaningless political theatre, but they may be dissuading governments from borrowing to finance productive nation-building investment.
One of the most misunderstood economic terms is “national debt”. That lack of understanding, however, doesn’t stop politicians from using figures on “national debt” to mount scare campaigns and to accuse the government of mismanagement, as Pauline Hanson did in her Press Club speech.
When we hear that our “national debt” is approaching a trillion dollars we are inclined to think of our debt to the rest of the world: that’s surely what the word “national” means.
In fact Australians are in debt to the rest of the world. Our net debt to foreigners is $1.4 trillion. This is offset by Australians’ net equity in other countries’ assets – of $0.7 trillion. resulting in a what is known as a “net international investment position” of minus $0.7 trillion in round numbers.
That’s what could be thought of as our national debt in everyday terms. It is regularly updated by the ABS in its Balance of Payments series, and is explained well in a 2022 Reserve Bank Bulletin article by Nicole Adams and Tim Atkin: The Significant Shift in Australia's Balance of Payments. As our investments in other countries rise, mainly in the form of shares held by superannuation funds, our net international position has fallen from around 60 percent of GDP in 2018 to 25 percent now. In other words the amount we owe the rest of the world is falling, as it has been for many years.
But that is not what is known as the “national debt”, a term with ancient historical roots that have little relationship to everyday language. The term actually refers to the gross borrowing by a country’s central government – in our case the Commonwealth government. This is reported in Budget Statement 3 to amount to $1051 billion, or 34.0 percent of GDP, for this financial year.
This is the figure that has Hanson so excited, and taking their cue from One Nation, the Liberal Party (or what’s left of it) has mounted a scary website Labor’s debt, with rapidly updating numbers conveying a dire warning of imminent catastrophe. Here’s a screenshot as at 09:26:38 on Thursday July 9:
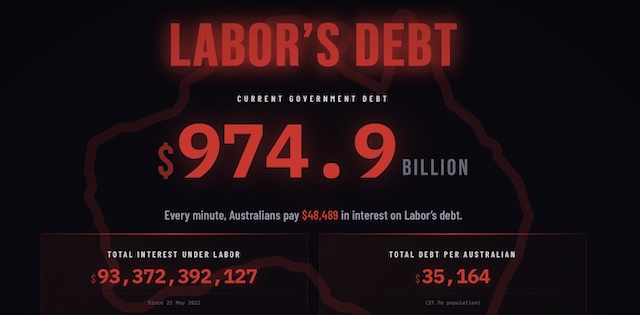
Apart from providing a basis for right-wing populists to run scare campaigns, that number is fairly useless, because it’s a record of gross debt. The Commonwealth borrows, holds cash and lends. That $1051 billion of borrowing is offset by $334 billion of Commonwealth financial assets, bringing the Commonwealth’s net debt to $617 billion or 19.9 percent of GDP.
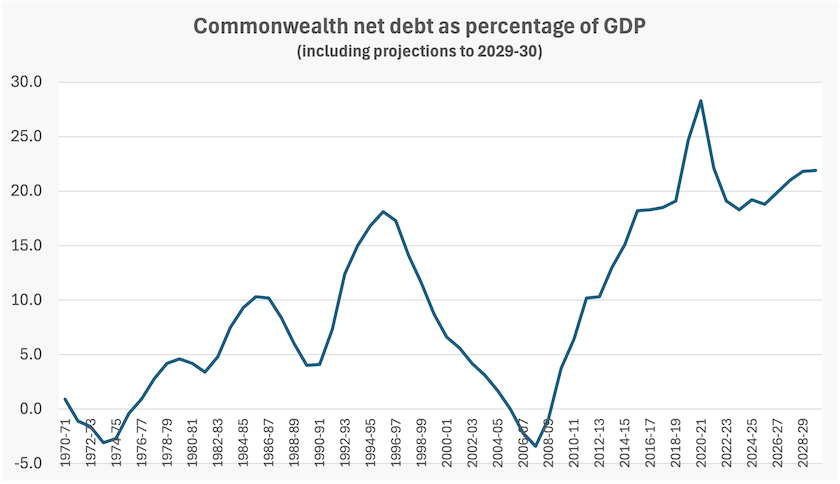
As for that Liberal Party line about “Labor’s debt”, most of it was actually accumulated during the last period of Coalition governments, culminating during the Covid pandemic when there was a raft of fiscal stimulatory measures to keep firms and the economy afloat. The recent history of Commonwealth net debt, including projections to 2029-30, is shown in the graph below.
We don’t learn much from looking at any entity’s level of debt in isolation. For most businesses we consider its balance sheet. If it has incurred liabilities, what are those liabilities funding – useful assets or an accumulation of past losses? We need to think the same way about government debt.
In the case of the Commonwealth there is a complicating factor, in that capital grants it makes to the states – for hospitals, roads and so on – are written off on the Commonwealth books as expenses. They move straight to the states’ balance sheets.
State and local governments do a great amount of borrowing and investment in Australia. When we look at a consolidated figure for net government debt, covering all three tiers of government, and netting out debts governments owe one another, we find that our net public sector debt in 2024-25 was $955 billion, or 34.4 percent of GDP.
Is that too high or too low?
In fact there is no rule that a certain level of debt is “bad”. Those who criticize governments for incurring debt point out, correctly, that governments must pay interest on debt. (See the Coalition’s scary display). That is so, but if the economic return on the assets funded by that debt exceeds the cost of financing those assets – the interest paid in most cases – the debt is economically justified.
A corporation that refrains from using some level of debt to finance its investments would rightly be criticized for bypassing investment opportunities. So too it should be with governments, particularly since governments can borrow at low interest rates. The Commonwealth’s $617 billion of net debt incurs interest of $20 billion, or 3.2 percent. That is budgeted to rise in coming years as old debt, taken out when interest rates were lower, matures, but compared with interest rates paid in the private sector it is still a low cost of finance.
So it is with state governments: they too can borrow at favourable rates. It can be argued that state governments have called on the private sector to fund infrastructure that should be funded through government debt, because their cost of finance is much lower than the private sector’s cost of finance.
We are paying too much for electricity because we have to pay the private sector’s cost of capital to finance power lines, and if we had borrowed to finance urban roads we would be free of the distortion of toll roads in Melbourne and Sydney. Suggestions that governments are borrowing too much generally emanate from the right of the political spectrum: when decoded they generally mean that governments, when they fund infrastructure from public sources, are depriving private financiers of opportunities to enjoy monopoly profits.
Criticism of government debt is in order, however, when it has accumulated as a result of a long run of deficits on current receipts and outlays, rather than spending on public assets.
Some state governments have been subject to criticism for allowing state debt to accumulate. Sydney Morning Heraldjournalist Shane Wright has pulled together some projections of state debt – Post-COVID debt explosion a major challenge for all states, bar one. He is critical of the Victorian, New South Wales and Queensland governments for letting debt grow rapidly, but these are also the states with high population growth, that are investing heavily in infrastructure in anticipation of that growth. The only state that seems to have over-extended itself with debt is Tasmania, because it has hardly any population growth. Even if Victoria’s “Big Build” is overpriced, allegedly because of corrupt deals with unions, it will have a new suburban subway and a completed city quality ring road, while Tasmania will finish up with a little-used football stadium. It’s the quality of public investment that counts, not its level.
Coming back to the Hanson and Liberal Party scare campaigns, there is no evidence that we have a national debt problem. We have a negative “net international investment position” with the rest of the world – what most people would normally think of as our nation’s debt. But that is not in itself a problem.
The Hanson-Liberal focus relies on a definition of “national debt” that is meaningless in itself, because it refers only to gross debt, applies only to one tier of government, and says nothing about what that debt is funding. But if we do apply meaning to “gross debt” it is informative to look at Australia in relation to the rest of the world. Visual Capitalist has a map of gross debt by country, showing that in comparison with other countries, at 51 percent, we really are a laggard. Most other “developed” countries have government debt well in excess of 100 percent of GDP. Perhaps the campaign opposition parties should run is to ask why our government is reluctant to use its strong fiscal position to finance nation-building infrastructure.
Wages are down but incomes are up – a reconciliation
Reports of a dramatic fall in living standards are misleading, because they gloss over real problems of distorted economic structures which leave wage-earners undercompensated compared with those who live off the income from capital.
“Australians suffer sharp decline in living standards” is the headline of an article in the Financial Review by Michael Read, drawing on an OECD report. Variants on the same story appeared in other media, including the ABC.
The source of these reports is the 2026 edition of the OECD Employment Outlook, an analysis of labour market conditions in OECD countries. Its focus is on wages and employment conditions, rather than on the whole economy. “Job markets remain strong, but real wages are lagging” reads the press release accompanying the report. It finds that in many OECD countries although there are still structural labour shortages, real wages on average are still below the levels of early 2021.
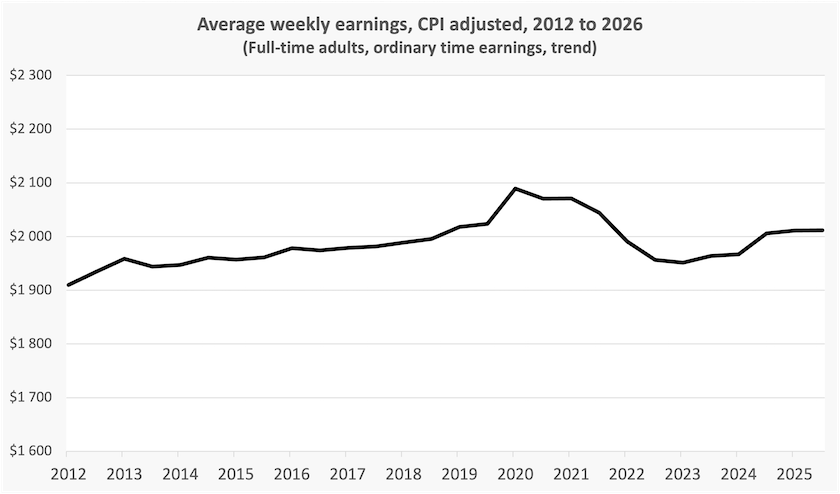
It has a short supplementary report on Australia, pointing out that although in terms of labour force participation and employment Australia is doing well relative to other OECD countries, real hourly wages have fallen by about 5 percent since 2021. That is confirmed by the ABS Wage Price Index: hourly rates pf pay fell by 5.6 percent between June 2021 and March 2023. That fall was three years ago. There is no evidence of a recent “dramatic decline” as the media reports describe: in fact hourly pay has risen a little since 2023.
This same trend is revealed in ABS Average Weekly Earnings data, shown below.
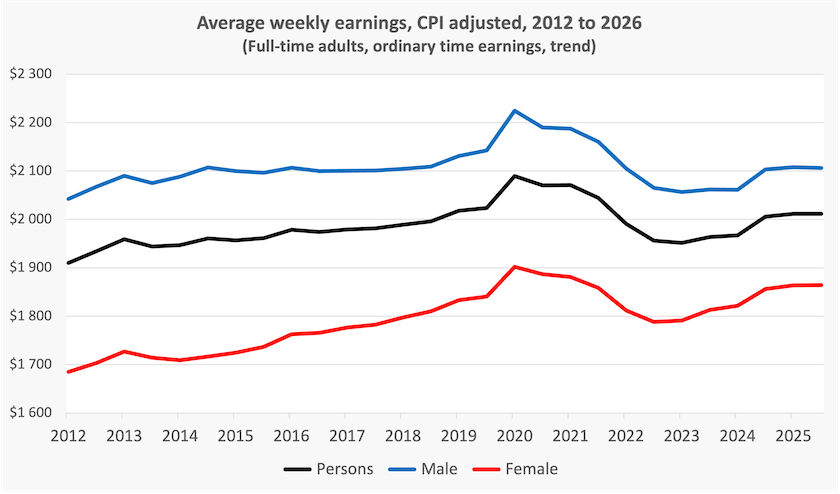
We learn a little more about what has been happening in our labour market when we look at earnings by gender. That fall in earnings has been experienced by men, while women’s earnings are almost back to their Covid peak. At play are probably two factors – higher award pay in industries such as child care, and a growth in employment in industries employing female professionals, particularly health care.
As for the broader claim that “Australians suffer a sharp decline in living standards”, the evidence is not there. National accounts reveal that our per-capita disposable income has fallen a little from its Covid peak – shown below – but our disposable incomes are well up on their pre-Covid level.
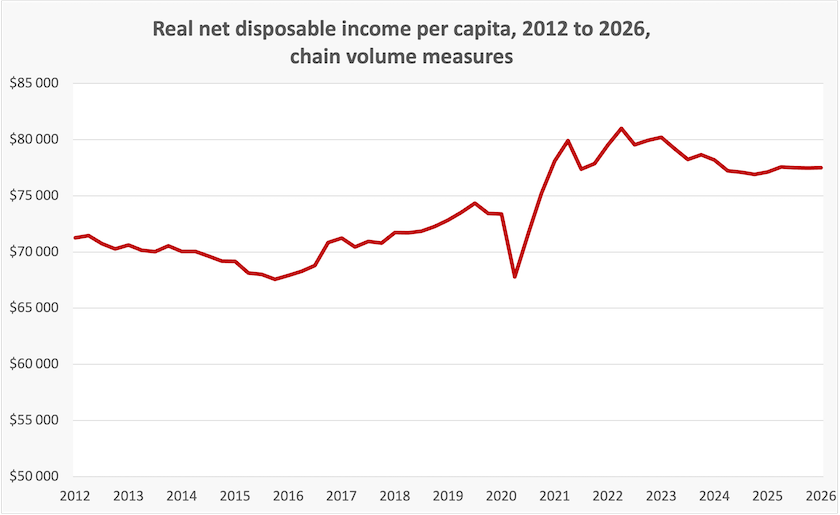
At first sight there seems to be a basic contradiction in our data: Wages are falling but income is rising! But not all income is wage income. People enjoy income from businesses in the form of dividends and capital gain. Wealthy retirees’ disposable income is further boosted by generous tax breaks. The distinction is important, because it is about one of the basic inequities in our society: wage earners get a poorer deal than those who live off investment income.
This may all come across as nitpicking of Michael Read’s article. The message of a journalist’s article is often sensationalised by a sub-editor who writes a misleading headline. But it’s the headline that commands attention, as does the catchphrase “cost of living crisis”, which implies that we’re all doing it tough. (The partisan version is that we were doing well until Labor was elected, which is contrary to the evidence.)
We’re not all doing it tough. Some Australians are doing very well. Just this week Alan Kohler has published data, compiled by Kos Samaras, showing variations in disposable incomes by region. On average, those who live in “inner metropolitan” regions are doing well, but those who live in outer suburbs and in non-metropolitan regions are going backwards.
The false idea that we’re all doing it tough is a distraction from structural problems that have resulted in widening disparities in income, financial wealth and opportunity. These, in turn, have been exacerbated by perverse incentives in our taxation and transfer systems. This means the links between contribution and rewards are becoming weaker, diverting employment and investment away from productive activity. The screams of the privileged, in reaction to recent minor taxation changes, illustrate the problem faced by a government trying to rectify these distortions. Journalists don’t help governments address necessary structural change when they reinforce the false idea that we’re all doing it tough.