Economics
Once upon a time in the West
The Morrison government’s GST deal with Western Australia is more than a normal Commonwealth-state fiscal row. It is also about the basic distributional rules holding the Commonwealth together.
To understand the conflict over the distribution of GST revenue, imagine that you’re the patriarch (or matriarch) of a big blended family, with 8 children. You have been giving them allowances of pocket money based on the way you assess their needs. Roughly the same for all, but a bit more for the older children, a bit more for one who has to travel further to school, a bit less for one who is getting an allowance from a step-parent, and so on.
Then one child does really well – she has a part-time job as a math tutor for a child in an extremely rich family, and is enjoying what can only be called a windfall. Do you cut her allowance, particularly if some of the other children are finding their allowances inadequate and your own resources are limited?
That’s roughly where the Morrison government found itself in 2018, in relation to distribution of GST revenue to the states and territories – revenue collected by the Commonwealth, and distributed to the states on a needs basis. That basis has been calculated by the independent Commonwealth Grants Commission, established in 1933, and up to 2018 the Commonwealth had been using the Commission’s formulas as the basis of distribution of untied grants and since 2000 revenue from the GST.
Needs are calculated on the capacity of each jurisdiction to provide public services to the same standard. There is consideration of the way needs differ between states: for example Tasmania’s isolation and comparatively small population mean that some services are expensive to provide; Queensland’s size requires it to provide a large road network. And there is also consideration of the capacity of states to raise revenue to fund their own needs. States with mineral endowments are in a relatively strong position to contribute to funding their own needs.
Here’s where iron ore comes into the picture. In 2018 iron ore prices were high, and production was at a record high. Western Australia’s capacity to raise its own revenue therefore was high – to the extent that it was likely to get back a very small share of GST revenue. Western Australians knew they were paying GST every time they went to the shops, and the state government made sure they knew they weren’t getting much of it back.
So the Morrison government did a deal with the Western Australian government, essentially setting a floor for its share of GST revenue, breaking the 85-year-old convention.
The current Commonwealth government referred the matter to the Productivity Commission for advice, and they came back on Friday last week with their interim report: GST distribution Reforms. Their findings and recommendations are summarized in their press release provocatively titled 2018 GST reforms a costly mistake.
Tax expert Robert Breunig of ANU has a Conversation contribution: “A costly mistake”: new review finds giving WA billions in extra GST was unfair to other states. In turn he cites independent economist Saul Eslake who for many years has been pointing out the unfairness and the cost of the deal, which he has called the worst public policy decision of the 21st century thus far.
For a rationalization of the deal you can hear Mathias Cormann, who has taken a few minutes of leave from his job as OECD Secretry-General, speaking on Radio National to defend the decision in which he had a major part as Finance Minister in 2018.
The overpayment has been costly – Eslake calculates that the accumulated cost to public revenue will have been $43 billion by 2028-29 – payments having blown out further than original estimates because the iron ore market has been stronger than Treasury had forecast. Even so, that’s only about $6 billion a year, spread over 25 million Australians who live in the other 7 states and territories, among whom another $240 a head for schools, hospitals and roads doesn’t go very far. That’s one reason why the deal has not been a major news item, even though it represents a major shift from the conventions that have held our Commonwealth together.
Two years ago Albanese, in an interview with a Western Australian journalist, promised to retain the state’s deal. This time he has been under pressure to make a similar promise, as reported by the ABC’s Cason Ho: WA Premier Roger Cook lashes “east-coast clowns” over interim Productivity Commission GST report. Cook stated “The prime minister told me the arrangements in place for Western Australia will remain”.
Saul Eslake has mounted on his website an ABC News Clip that includes predictable comments from other premiers, inane comments from state opposition leader Basil Zempilas, and his own more detached comments.
The electoral context – how the west is won
Quite apart from the historical fact that Western Australia was the state least enthusiastic about federation in 1901, there are recent political developments.
In 2018 the Liberal Party held 11 of the state’s 16 federal seats, and held on to them in the 2019 election.
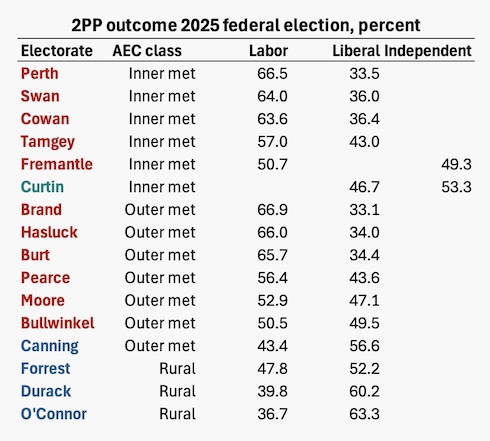
In 2022 it lost 6 seats – 5 to Labor and 1 to independent Kate Chaney, and in 2025 it suffered further losses, retaining only 3 rural seats and one outer-metropolitan seat (Andrew Hastie’s). Western Australia now appears to be Labor territory, and Labor is likely to be determined to hold that territory.
But the story may be a little more complicated, because of Labor’s 11 seats, only 3 are on a slim margin, and one of these is likely to be lost to an independent anyway. The table below shows the final TPP results of the 2025 election. In view of Labor’s strong position in other Western Australian seats Labor’s national strategists may not see value in an all-out effort to save Western Australian seats.
The broader context – what sort of commonwealth are we?
Federations are delicate political arrangements. They hold together when the disparities between different states are kept within bounds.
As described above, and in more detail in the Productivity Commission Report, Australia has a long tradition of ensuring that each jurisdiction can provide the same standard of government services – known as “horizontal fiscal equalization”.
This specific provision applies only to government services, and it carries no obligation on states to actually provide those services. A state government could decide to reduce taxes on its own citizens rather than to collect them at the level assessed by the Grants Commission. (This is not entirely theoretical: for example the Western Australian government has restricted gambling to one casino, reducing its capacity to collect gambling taxes as the Grants Commission calculates.)
State services – school education, hospitals, local roads, policing, urban amenity – provide a large portion of the social wage, and therefore contribute to a degree of levelling across jurisdictions. Horizontal fiscal equalization has probably protected Australia from the huge variation we see in public services between US states.
It is not only the Grants Commission process that contributes to equalization of incomes between states. Our personal redistributive transfers, including age pensions, unemployment benefits and other social security programs operate on a Commonwealth level, and the Commonwealth picks up the major taxes with redistributive consequences – personal income tax and goods and services tax.
This suite of redistributive arrangements has helped to keep the lid on regional disparities. The chart below shows the distribution of per-capita Gross State Product (GDP on a state scale) and per-capita disposable income by state. Note the considerable flattening of the latter compared with the former. (The territories are small jurisdictions with large Commonwealth programs, producing high figures for disposable income.)
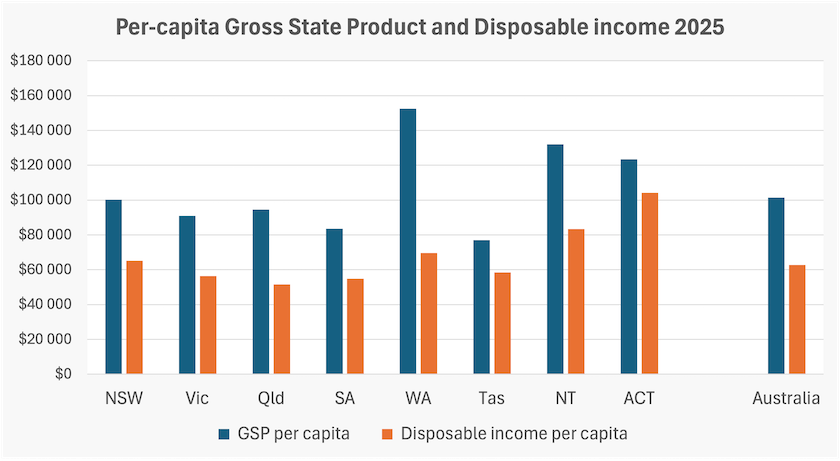
Among the states Western Australia has the highest disposable income per head ($69 500) and Queensland the lowest ($51 600). That’s about a 1:1.35 ratio, which is a little higher than Germany’s, another federation with wide variation in per-capita GSP. Germany’s highest-income state, Bayern, has per-capita disposable income of €31 500, compared with €25 100 in Sachsen-Anhalt – a 1:1.25 ratio. The USA by contrast has almost a 2:1 ratio of personal income between states – around $US100 000 in Connecticut and Massachusetts, and $US55 000 in West Virginia and Mississippi.
A dedicated free-market economist may assert that policies that flatten regional disparities have an opportunity cost, in that they discourage people from moving to places where they can be more productive. It’s a plausible argument, but Eslake effectively dismisses it in his statement linked above.
The more basic question is about the sort of country we want to be. Regional disparities can grow to the extent that they tear countries apart. Geography makes it hard enough to hold Western Australia in the Commonwealth, and as the country undergoes an energy transformation Western Australia stands to benefit more than the eastern states. We surely don’t want public policies that add to those centrifugal forces widening disparities.
Tomago aluminium smelter
The $2.5 billion funding package to keep the Tomago aluminium smelter operating is more than a bail-out: it’s about restoring our competitive strength and decarbonizing our industries.
After a long period of negotiation between the Commonwealth and New South Wales governments and the owners of the Tomago aluminium smelter in the Hunter Valley, the Commonwealth and state governments have agreed on a bail-out that will involve government outlays of $2.5 billion over the next ten years.
Roy Green of Sydney’s University of Technology explains in his Conversation contribution that this is no ordinary bailout, because it involves agreements on all sides about power supply and the company’s commitment to invest in renewable energy. Under the agreement Tomago will move to 50 percent renewable energy by 2030 and 100 percent by 2035. This timetable coincides roughly with the scheduled closure of AGL’s Bayswater power station in 2033, a 42-year-old coal-fired station with a capacity of 2.7 GW that has been supplying Tomago.
This is a significant transition. Tomago smelter is Australia’s largest electricity user, taking a constant load of almost 1 GW, according to Giles Parkinson writing in Renew Economy: Australia’s biggest aluminium smelter gets $2.5 billion to help transition from coal to wind and solar. That transition will require 3 GW of solar and wind capacity, firmed by storage and possibly peaking gas capacity.
One reason this agreement is no ordinary bailout is the nature of the government investment, described by the parties as a “Specialist Investment Vehicle”, a mechanism combining elements of equity and loan finance. Writing in Australian Resources & Investment, Engel Schmidl describes it:
The Tomago arrangements also introduce an interesting element of risk sharing. While governments are providing substantial support, the agreement includes provisions for revenue to return to the Federal Government when aluminium prices are high.
The model therefore goes beyond a straightforward subsidy, linking public support for strategically important processing capacity with exposure to stronger commodity-market conditions.
True to form, the Opposition has been quick off the mark to condemn the plan. In a Dorothy-Dix style interview with 2GB’s Michael McLaren, Andrew Hastie explains:
if we're going to get this country going in the right direction, we've got to get out of net zero, and we've got to deliver cheaper base load power. We've got to use the coal, the gas, the uranium that we have an abundance of, and become an energy superpower – that's the only way we revive Australia's economy because energy is central to it.
Hastie isn’t stupid. He would know that the smelter is struggling because it has been relying on expensive coal-fired power. Had the Abbott government not set back Australia’s energy transition by many years the smelter would already be running on low-cost renewable energy and there would be no need for a bailout. As for uranium, as we learned last year it is even more expensive than coal. And he reveals that the party is still talking about “base load” power.
He claims that aluminium produced by Tomago will be uneconomic because the world won’t be willing to pay a premium for green aluminium. But because renewables are the cheapest source of electrical energy, and electricity makes up 40 percent of the cost of producing aluminium, Tomago’s aluminium will be cheaper than aluminium produced from coal-fired electricity – if any smelter in the world is still operating on such expensive electricity in a few years. In fact when trading blocs such as the EU impose a border price adjustment mechanism (a non-Trumpian word for an environmental tariff) on aluminium produced from fossil-fuel generated electricity, Tomago aluminium should enjoy a significant competitive advantage.
Hastie’s economically incoherent comments probably fit with a Coalition political strategy that sees Labor-held non-capital city electorates like Newcastle and Hunter as contestable, particularly in light of the importance of coal mining in this region. One Nation, if it hasn’t biodegraded by 2028, would be making a pitch for these seats. In the 2025 election One Nation achieved 16 percent of the primary vote in the Hunter electorate. Other parties on the far right – Trumpet of Patriots, Family First, Shooters and Fishers – achieved a further 7 percent of the vote. In Hunter the populist and authoritarian right is already on a high base.
Is a housing price collapse on its way?
A dramatic collapse in housing prices is unlikely, but significant falls are possible. Such a reversal of inflation would be a good outcome.
In one day in 1929, between 23 October and 24 October, the US share market fell by 11 percent, and was to fall another 78 percent over the next three years.
That was a real crash, the first event in what has come to be known as the Great Depression.
Scaremongers are now suggesting that something similar will happen to the housing market in Australia.
Whatever happens, it won’t be so catastrophic for two reasons. One is that even in 1929 share transactions were fast and easy. The naivest of naive investors can get into the share market with little effort. Buying and selling houses takes time, and requires some assessment of one’s financial resilience. And we need houses, in the same way that we don’t need a portfolio of shares.
The housing market should be different from financial markets, because traditionally we have built houses to live in, not as things to trade. But because of changes in tax arrangements, and a spirit of irrational financial exuberance around the turn of this century housing became a financialized commodity, and has become subject to the same disequilibrating processes as other financial markets.
Financialized markets rarely come to some neat “equilibrium” price, set by the forces of supply and demand, as modelled in Economics 1 textbooks. Rather they are subject to positive feedback forces which tend to drive prices away from any stable price – upwards in a boom, downwards in a collapse.
No-one knows just what switches a market from one direction to the another. Something triggered the switch on 23 October 1929 – historians are still arguing – and something seems to have triggered a switch in the Australian housing market in 2026. It might be the effect of the Reserve Bank’s decision in May to raise interest rates by 0.25 percent. It might be the government’s minor changes in taxes that have discouraged property speculators. It may be overinterpretation of reports of small falls in housing prices in Sydney and Melbourne – falls that someone with a basic knowledge of statistics would normally ignore.
Whatever the immediate cause, the switch from a bull to a bear market happens at some time when there is a consensus that the market is overvalued. But the switch has consequences, and the losers look for someone to blame. As housing speculators, real-estate agents, mortgage brokers and others who take a cut out of transactions see it, someone is trying to poop the party, and they’re directing their anger at this horrible anti-business dangerously socialist economically incompetent pro-union Labor government.
In fact the public feel reasonably comfortable with the direction the housing market is taking. William Bowe reports on his Poll Bludger site that Resolve survey data shows that 60 percent of respondents support the government’s objective of bringing house prices down. As the Reserve Bank keeps asserting, people don’t like inflation, and it’s a reasonable conclusion that people are reasonably happy to see prices of one very significant item of expenditure to be falling.
What we don’t know is how far house prices might fall, and it would be a brave person who would put some categorical estimate on the market’s likely low point.
A short history of Australian house prices
Part of the problem in understanding the housing market is the way data is presented in the media. We often see a graph like the one below, with three key events noted. Although this is not obvious on the graph, note that the Y axis starts at 100.
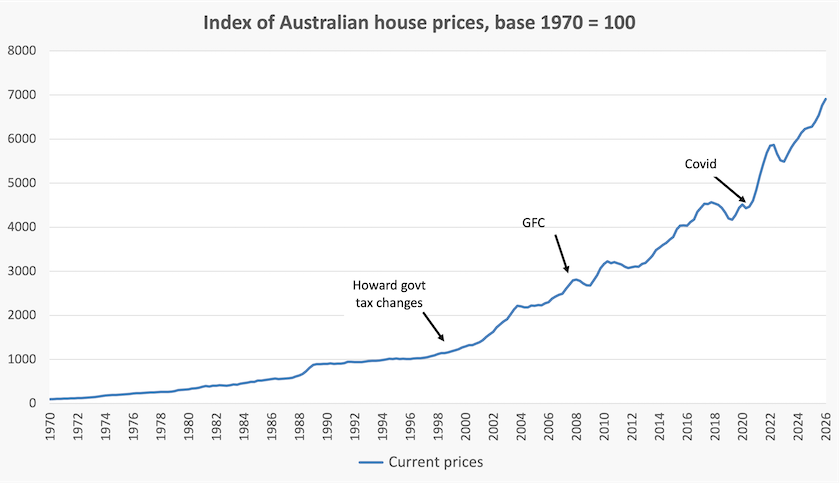
That shows house prices are now 70 times as high as they were a half century ago – a rather scary number, but over the same period prices generally have risen 15 times, as indicated by the CPI. This sort of figure is close to meaningless.
When we make an adjustment deflating the nominal index by the CPI, we get something resembling the red line which has been added to the graph.
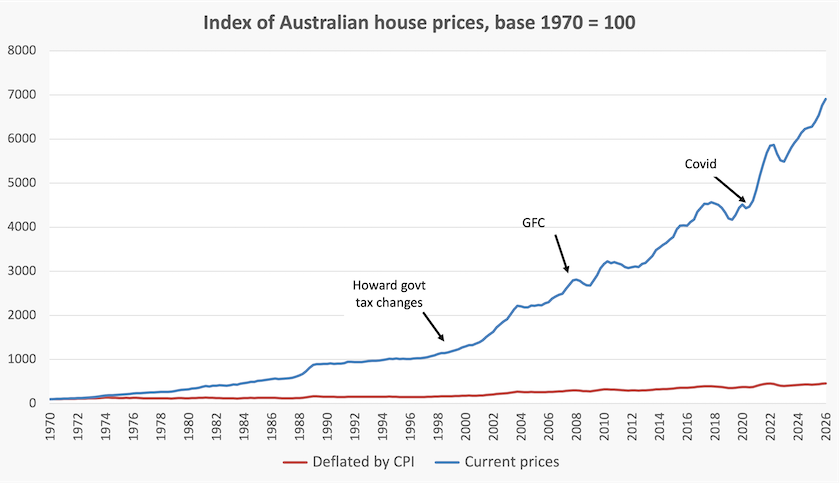
Unfortunately, because it is so much flatter, it doesn’t tell us much. but when we plot it on its own, without the distortion of a large-scale vertical axis, we get the following graph.
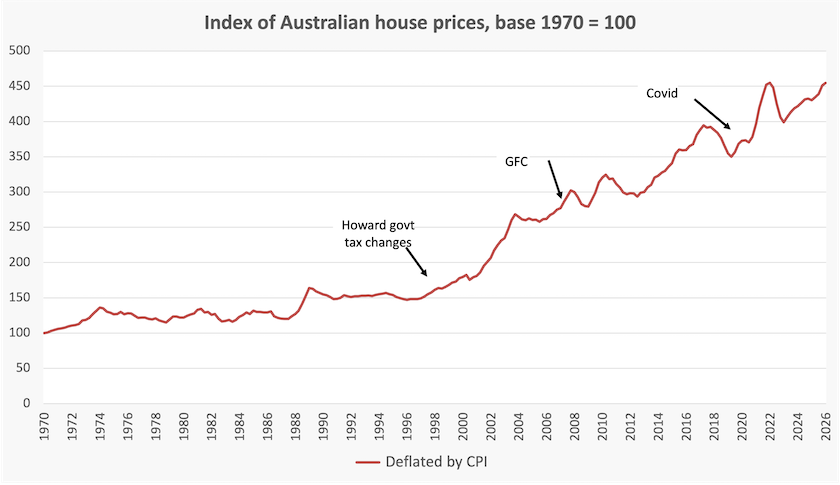
That shows house prices have risen by a factor of about 4.5 in real terms. Note that most of the movement has been in this century.
Not too much precision should be read into such figures. Such long-term conversions are always tricky. The quality of new housing has improved remarkably since 1970. (Think about bathrooms and kitchens for a start.) Real incomes have risen. Almost all houses built in 1970 were free-standing. And the housing market is highly regionalised. But we can see some trends, hinting at the factors that have contributed to the financialization of housing and to the bumps in that red line.
There was a distinct bump in the 1980s, around the time of the Hawke-Keating government’s partial deregulation of the finance sector. The sustained upward trend starts when the Howard government, under pressure from the finance sector, changed the capital gains tax system, in a way that lightened taxes on assets with rapid capital gains, while it increased taxes on more capital-stable assets (a point conveniently overlooked by the partisan press). These are the changes the government has effectively reversed.
The Howard changes established a wonderful time for speculators, many of whom even call themselves “investors”, oblivious to the reality that they simply shift around the ownership of existing housing assets. There have been small falls in real prices – for example a 9 percent fall in the two years just before the Covid pandemic – but because these were largely masked by inflation the financial markets and the financial press didn’t really notice them.
Has the market turned? It probbaly has.
Latest figures from Cotality, reporting on August prices, suggest that the market may be turning. Their August press release can be paraphrased as a message to “investors” that “prices are falling, but you’ve still done bloody well”, although their language is a little more refined.
The ABC’s Ian Verrender has a post Why the Kiwi and Canadian property bubbles burst and what we can learn. He re-presents Cotality figures, indicating that capital city prices probably peaked about a year ago, and have fallen 0.3 percent to 1.4 percent since. That would indicate an inflation-adjusted fall of between 4 and 5 percent.
Verrender attributes the rough ride of New Zealand and Canadian housing prices to those countries’ more aggressive monetary policies, and the absence of strong population growth which would have otherwise sustained higher prices.
Another country we can look at is the USA. The graph below shows their deflated prices over that same 70-year period, over which time real prices doubled. That compares with our 4.5 times move. The event that really affected US house prices was the GFC, when prices fell by 25 percent before starting to recover. In fact the GFC had its roots on America’s housing market. Rising interest rates seem to be now driving another fall in prices.
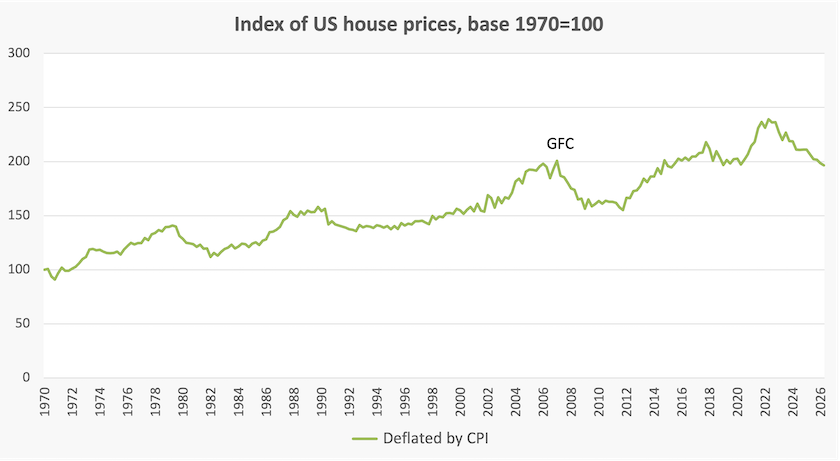
Other countries’ experiences don’t translate easily to Australia. The USA housing market is much more regionalized than ours, and their system of fixed mortgage rates has effects not manifest in Australia. But their experience shows that housing prices can fall substantially, even though their rise in house prices has been much less dramatic than ours.
So-called “investors” are still in a red-hot rage against the Albanese government for having reverted to a neutral system of capital gain taxation, but they don’t realize that the government’s changes are actually in their favour. When they sell their properties many will find that they would pay more tax under the Howard system than under the re-established indexation system, because the Howard system taxes nominal capital gains while the indexation system compensates for inflation. The Howard system is friendly to “investors” only in a bull market.
Will their financial advisers point this out? Probably not – a scan of financial pages reporting on financial advisers suggests that loyalty to parties on the right overshadows their obligations to their clients. They are unlikely to acknowledge that One Nation, the Liberal Party and the National Party have promised to go back to the Howard system, which would be tough on those selling in a market that does not keep up with inflation.