Economics
Interest rates – the RBA is hostage to an arbitrary formula
If the community had a better understanding of inflation than the CPI headline figure, the RBA would probably not have raised interest rates.
Once the December CPI came in at 3.8 percent most economists were predicting that the Reserve Bank would raise interest rates, although many were arguing that it would be wiser to keep rates on hold.
Their prediction was right: the RBA raised the cash rate from 3.60 percent to 3.85 percent, effectively reversing the cut it made just last August. Writing in The Conversation Stella Huangfu of the University of Sydney gives a straightforward, orthodox explanation of the decision. For an analysis of the thinking behind the decision there is Peter Martin’s episode of The Economy Stupid – Will this be the last rate hike? – where he interviews Michael Pascoe of Michael West Media and Cherelle Murphy of EY. The interview is about the Bank’s difficulty in using one policy instrument to regulate an economy where some parts have capacity pressures and others have capacity to spare, and the trade-off between the Bank’s inflation and employment mandates: these are the age-old problems of monetary policy.
The Bank’s justification, summarized in its press release, is that there was a pick-up in inflation in the second half of 2025, and a belief, based in part on the strength of the labour market, that the economy is running at or just above its capacity. It seems to be having two bob each way, although the two possible causes are tightly related.
Something doesn’t ring true. If inflation was rising in the second half of 2025, why did they cut rates in August? Their excuse is probably that the CPI was moving downwards, but surely the bank’s board, and their highly-qualified staff, keep an eye on all aspects of the economy, and not just the CPI – a lagging statistical indicator. In fact we know, from the detail in their Statement on Monetary Policy, that they track a wide set of indicators, supplemented by their own analysis.
More basically, while there may be short-term changes in prices showing up in the CPI, the price movements that constitute a serious inflation problem – a self-sustaining and possibly accelerating cycle of upward price movements resulting from positive feedback loops – take time to develop and they take time to suppress through monetary or fiscal policy. They don’t change from month to month.
Similarly with the economy’s general capacity: it doesn’t change substantially between August and February.
Underlying inflationary pressure, and the economy’s capacity, are closely related to productivity, and as economists stress, including RBA economists, improvements in productivity are slow to realize.
To get some idea of the dynamics driving the RBA’s decision, it’s informative to look at the CPI in its raw form, as index numbers. That’s the form that generates the final figures on movement. When we look at the CPI in that basic form it appears that the RBA has over-reacted to movements in a less-than-reliable formula.
Monthly index numbers are shown in the chart below, with the December 2024 and December 2025 numbers highlighted.
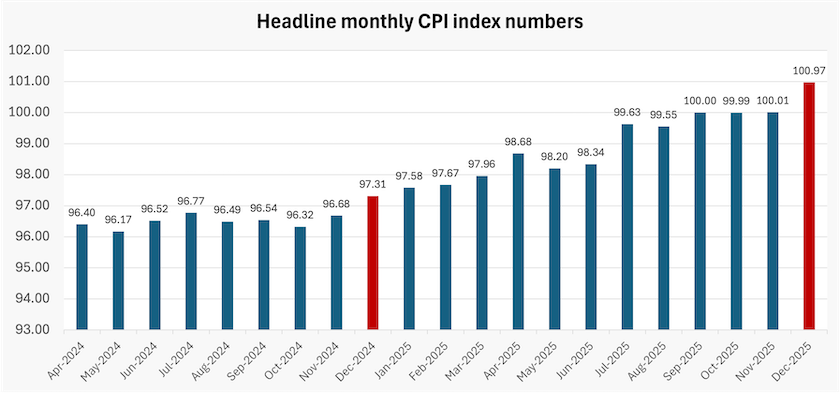
From those two points the following simple equation ((December 2025 number/December 2024 number) – 1) is shown below:
(100.97/97.31) – 1 = 0.0376
That rounds to 3.8 percent, the newsworthy headline inflation published by the ABS in its regular release on January 28.
Note that it’s based on only two data points, one of which is 13 months old. More basically, each has its own error of estimate, which means that any calculation of change in the numbers is subject to a double error.
What stands out in this instance is the December jump in the index number.
The Liberal Party spokesperson, Ted O’Brien who calls himself the “shadow treasurer”, asserts that it’s all due to reckless government spending. In a clear explanation in an 8-minute interview on Radio National Pradeep Philip of Deloitte Access Economics puts paid to this Liberal Party claptrap. The problem, he explains in detail, is the economy’s productive capacity. That’s a manifestation of low productivity which in turn relates to a lack of investment and in a lack of innovation.
Unfortunately, one of the consequences of interest rate rises is a slowdown in investment. This leads one to ask if the RBA is so concerned about the economy’s productive capacity, why is it discouraging investment? To be fair to the Bank, that’s a question about monetary policy generally, not just in Australia in 2026. It’s a crude and ineffective mechanism to regulate the economy.
We get some clues about that December jump from the ABS official release: electricity rebates were being discontinued; there were big rises in some food prices, probably associated with weather; there was a 7 percent rise in the “recreation and culture” component [1], presumably fuelled by the majority of Australians who aren’t suffering a cost-of-living crisis.
In the words of statisticians, the movement is probably seasonal, and it is partially due to some once-off factors.
Fortunately the ABS produces index numbers that overcome these limitations. (Table 6 on the ABS website). If one uses the seasonally-adjusted index, and uses only the November and December movement as an indicator of the present movement, the annualized CPI rise turns out to be only 2.4 percent, a measure Alan Kohler presents on the ABC website.
A more appropriate indicator may be the seasonally-adjusted trimmed mean, the trimming referring to the removal of volatile items. Using the same starting-point-finishing-point comparison as is used for the headline figure, that gives an annual rise of 3.3 percent, but a weighting that gives proportionately more meaning to more recent movements (a standard statistical technique [2] gives an annual rise of 2.5 percent.
These re-calculations are not intended to make any categorical claim about the true level of inflation, but they are a reminder that just one of several methods gets prominence. In fact, to stress a more basic point, the CPI is an indicator of movements in households’ cost of living, while “inflation” is about price rises throughout the economy – households, businesses and government. The CPI is highly sensitive to government policies that directly affect households, including electricity rebates, taxes on alcohol and tobacco, subsidies for household batteries, subsidies for pharmaceuticals and gasoline excise, to name just a few interventions. If the rates of these taxes and subsidies were to hold over a long period, the CPI may be a useful indicator of inflation, but they don’t hold constant.
Of course the people at the Reserve Bank know all this. To repeat the point they’re among the country’s most able economists. And notably, in their press statement they don’t mention the CPI.
But the problem is that monetary policy has to deal with expectations of inflation, and it’s the headline figure that gets media prominence and political prominence from a right-wing party that thrives on spreading economic misinformation. If 3.8 percent becomes the salient number, it gives permission for firms to raise their prices accordingly, and for unions to lodge higher wage claims: it’s a classic collective action problem, because no-one wants to be left behind.
What’s worse in this case is the RBA’s published expectation that inflation will be 4.2 percent in the middle of this year. This seems to be based on the already determined levels of the CPI index for May and June 2025, which one can see by a glance at the graph form a low base. In other words that 4.2 percent rise is already partially baked in to the mid-year CPI because of a mathematical artefact, even though those figures are already history and by June the actual inflation may be quite different.
For now it seems that the CPI will retain its salience. Perhaps the ABS could help the RBA do its job by giving the seasonally-adjusted figures the prominence it now gives to the unadjusted figures. It could publish and give prominence to an indicator that takes a series of observations into account rather than starting and ending figures, and which gives more weight to more recent data. Any maybe it can develop a series stripping out all changes in subsidies. It could present various CPI indicators in a table, without giving prominence to any one of them.
It would be surprising if staff at the ABS and the RBA are not thinking the same way – and in other ways – as a protection from monetary policy being held hostage to a mathematically shonky formula.
1. The ABC’s Luke Cooper has a well-researched post on the ways we change our spending during heatwaves. Not only do we shift the times we shop, but we also spend more in pubs and clubs. We might wonder how much of that 7 percent rise in the “recreation and culture” component of the CPI was driven by opportunistic pricing of beer and soft drinks. ↩
2. This method gives the 12-month-old figure a weight of only 1/12, the 11-month-old figure a weight of 2/12, and so on, with the most recent figure having a weight of 12/12 in the averaging process.. ↩
Immigration – fertile ground for misinformation
With so much misinformation and racist dog-whistling, it’s hard to get a clear picture of immigration. It helps to start with population policy.
Many on the right of the political spectrum are longing for a public scare campaign on immigration.
Writing in the Sydney Morning Herald, Parnell Palme McGuiness of the Centre for Independent Studies describes how Pauline Hanson, buoyed by opinion polls and by the apparent success of anti-immigration parties in Germany, France and Britain, has a vision of One Nation leading a politically triumphant anti-immigration movement. Hanson’s simple belief is that “Voters flock to the political party which has a clear, simple message about immigration: there’s too much of it. And the wrong people”.
McGuiness doesn’t rate Hanson’s chance of success highly, but any observer of the current political landscape understands that One Nation can generate a great amount of noise about immigration.
When the issue does arise the public arena soon becomes populated by misconceptions, deliberate misinformation, and racist dog-whistles. In fact, as we are now seeing, dog-whistling is giving way to blatant and undisguised racism.
Even in the absence of these negative forces, it would be hard to hold a civilized and well-informed public debate about immigration, because meaningful data is so hard to come by. It’s not that the government or anyone else is keeping the data secret; rather it’s that in a country open to the world it’s hard even to define what an immigrant is. Is a foreign student an immigrant? How do we count someone who has Australian citizenship but lives overseas? Surely an Australian returning from overseas isn’t an immigrant (but for statistical purposes she is an immigrant). How do we count seasonal workers?
On a long summer afternoon, a group of us in Canberra found ourselves in an extended discussion about immigration, and soon learned that even retired academics and public servants, whose professional lives have been spent making sense of information from different sources, find it hard to get a clear picture of immigration. But that curiosity led to an endeavour to pull together what we could find from various sources in a set of notes – 13 pages in hard copy, and available as a pdf with rather a lot of numbers and graphs. To summarize those notes:
Immigration has to be seen in the context of world population, which is close to peaking. Some countries, once magnets for migrants, could soon find themselves begging for migrants to avoid population shrinkage and the economic burdens of age dependency.
Australia stands out among “developed” countries in having a comparatively low median age and comparatively high fertility – although our fertility is well below replacement rate and is low by our own historical standards, and our median age has been increasing from its 1975 low point.
It is true that about a third of our population is born overseas, and that is indeed high in comparison with other countries. Some countries with divisive political debates about immigration, such as the USA, the Netherlands, Germany and the UK, have much lower immigrant populations.
Our decision to close our borders during the Covid pandemic, and then to re-open them, sent the data off into strange directions, feeding disinformation campaigns. But if we smooth out the Covid bump our “permanent migration” – the people who pass the tests for becoming permanent residents – over the last twenty years has been fairly constant as a percentage of the population, and significantly below the percentage during the “postwar” migration boom.
There are many comings and goings of people who are counted as “migrants” because they stay in Australia for some time, but are not part of the permanent migration program. Of 667 000 overseas migrant arrivals in 2024, only 91 000 were permanent visa holders. But many migrants, such as students who completed their degrees and then became permanent residents, were already in the country and therefore didn’t “arrive”. And 60 000 returning Australian citizens were counted as arrivals. No wonder it’s confusing.
As Pauline Hanson keeps telling us (but with a negative spin), the composition of our migrants has been changing. In the ten years to 2023-24, 20 percent came from India, and 10 percent from China. It’s a long time since “ten pound poms” were walking ships’ gangways. Immigrants tend to settle in urban electorates that are held by Labor or independents.
There are distinct partisan differences in people’s attitudes to immigration – both its size and composition. Australians support multiculturalism, and don’t see the world in the US “people of color”/”white” binary division, but they have their likes and dislikes based on immigrants’ religion.
Much more information on immigration, but without data on countries of origin, can be found in the Commonwealth’s 2025 Population Statement. It properly puts immigration in the broader context of population policy, and has informative data on immigrants’ and natives’ demand for housing. (No, immigrants aren’t the major culprits in housing prices.) We can expect to see a continued attraction of migrants to capital cities, which means, for the foreseeable future, the ethnic and age differences between our capital cities and other regions of Australia will probably go on widening.
Upfront the document has a statement from the Treasurer that seems designed to placate those who want to see immigration numbers reduced, while it celebrates our ability to keep our population young through immigration. That’s just what a federal treasurer would say and is sufficiently vague to avoid a political stoush.

Can’t wait to display those Union Jacks
Right now it’s easy to imagine that anti-immigration “March for Australia” mob will continue to pursue their anti-immigration campaigns. They’ve invested heavily in those colonial-era flags and are longing for a chance to display them.
But a consideration of global demographics and economics, including the still-rising living standards in Asian countries, suggests that the days when countries like Australia can rely on a supply of skilled migrants to fill labour shortages and to keep their populations young may be numbered.
We learn from Brookings that net migration to the US has become negative. Undoubtedly Trump’s ICE thugs have helped generate that turnaround, but there is probably some underlying fall in the attraction of the US for migrants.
In the short-term there may be some benefits for Australia. Social media is awash with videoclips of Americans celebrating their move to Australia. (Hopefully they won’t bring their tipping culture with them.) The ABC’s Jeremy Story Carter has a post – What the 'I'm an American living in Australia' Instagram and TikTok trend reveals about both countries – in which US immigration and tax specialist David Lesperance explains how refugees from Trump’s America are attracted to Australia. Lesperance has the same message in a 5-minute clip.
Perhaps, to restore the numbers, the US Department of Immigration could offer special green cards to distressed One Nation supporters and other Australians who find themselves as “strangers in our own home” to quote the expressed pain and anguish of a Liberal Member of Parliament.
PALM – echoes of a dark era
A scheme ostensibly designed to benefit Australian companies and Pacific islanders drifts from its original mission.
In the nineteenth century an indentured labour scheme operated in colonial Queensland, involving owners of sugar plantations who lured more than 50 000 Pacific islanders to work in conditions that were akin to slavery.
Once again Pacific islanders, and now people from Timor-Leste, are being recruited to work as seasonal workers, mainly in agriculture and meat processing under what is known as the Pacific Australia Labour Mobility (PALM) scheme. Industries in Queensland are the main participants in the scheme.
In its design PALM has strong protection for workers, but writing in The Conversation – Australia’s Pacific worker scheme is far from perfect – but we can make it better – Peter Mares of Monash University is critical of the way it has drifted from its original mission, having become more a full-time employment scheme, breaking families apart. And he reports that the scheme “is dogged by reports of workers being abused, underpaid or housed in substandard, overpriced or overcrowded accommodation”. (That’s a common problem in rural industries, remote from the eye of the law, and where immigrant workers may not be working alongside native Australian workers who are aware of their rights.)
Mares is author of a report Improving Palm. Among his recommendations he suggests that PALM workers should be able to change jobs, rather than being tied to a single employer. That would take PALM one step further away from the loathed and exploitative indentured labour schemes of the nineteenth century.