Other economics
Poverty in Australia
Australia does not have a “cost of living crisis”.
Most Australians are well-off, and some are better-off than they have ever been before, but around one fifth lack the income or wealth to reach a decent standard of living. This is no longer the land of the fair go.
The report Material deprivation in Australia: the essentials of life, prepared by the Australian Council of Social Services and the University of Sydney, documents the struggle faced by those who are really doing it tough.
The report’s ten pages of “key findings” make for compelling reading.
You can also get an idea of the general context of this work in an ABC 730 interview – living with poverty in Australia – with ACOSS CEO Cassandra Goldie (introduced by Sarah Ferguson who cannot help referring to the imagined “cost of living crisis”).
It’s not about the 40 or 50 percent of Australians who have had to tighten their belts a little, who have to make the painful decision to holiday in Thailand rather than in Tuscany, or to defer buying a new car until next year – the chorus who nod in agreement when journalists lead us to believe we are all experiencing “a cost of living crisis”.
It’s about those who lack the means to enjoy the essentials of life. We have a problem in inequality.
The researchers use a list of 23 items – a separate bed for each child, dental treatment when needed, a substantial meal at least once a day, getting together with friends or relatives for a drink or meal at least once a month, a washing machine, and 18 others – which for most people would represent a basic living standard. These are the items “regarded by the majority of the population as necessary or essential”.
The list, developed through comprehensive social research – is the current equivalent of the idea of “frugal comfort” that historically defined the basic living standard all Australians should enjoy and set the basis for Australian egalitarianism
The ability of people to enjoy these basic amenities is largely, but not solely, dependent on income. People’s wealth (particularly house ownership) and their ability to tap into social networks, also count in their ability to enjoy a basic living standard.
The researchers focus on the extent of deprivation among people relying on social security payments (Jobseeker, Parenting Payment, Disability Support Pension, Youth Allowance, Carer Payment) and among specific groups (sole parent families, First Nations people, renters). There is clearly a significant overlap between these classifications.
The report is straightforward and factual. It does not have a set of recommendations or even a summary conclusion – just a summary of findings.
It would be hard for the reader not to conclude that our rates of income-support payments are grossly inadequate to allow people to enjoy a dignified life, in “frugal comfort”.
The report exposes a serious shortfall in our society. It has been decades in the making – going back to the 1980s when the ideology of neoliberalism with its emphasis on “small government” started to infect public policy. We have ignored the growing burden of poverty, because it has developed slowly, and we have sustained public myths about Australian egalitarianism and the land of the fair go.
More recently, as the economy has experienced a correction at the end of an unsustainable boom, we have hidden behind the idea of “a cost of living crisis” – a frame that implies we are all in it together suffering hardship, and that we can all enjoy life again, if only if we can get rid of this horrible Labor government.
During the Covid-19 pandemic for a short time income support payments were lifted to a level that allowed people to enjoy a dignified life. We have been shown a more decent Australia, the Australia of our egalitarian mythology.
Fortunately this is one of the few problems in public policy with a simple solution. That solution lies in tax reform – not just re-shuffling the incidence of taxes, but in ensuring that those who have benefited from our country’s extraordinary economic growth contribute back to the community. It’s about “mutual obligation” to use the right’s frame.
Disturbing inflation numbers from the ABS
The Consumer Price Index is only a first-order indicator of inflation, but the ABS Monthly Consumer Price Indicator for October, released on Wednesday, has a disturbing sign that Australia may be entering a period of deflation.
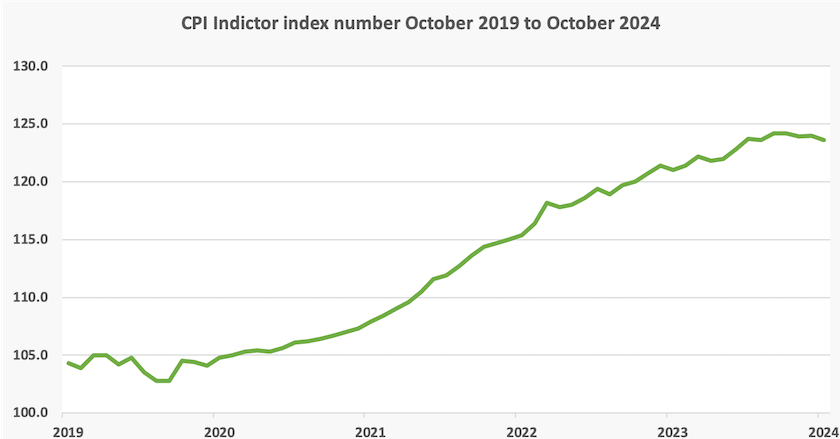
The October index number, of 123.6, was down from the September index number of 124.0, and even further below the peak of this index at 124.2. It’s falling rather quickly.
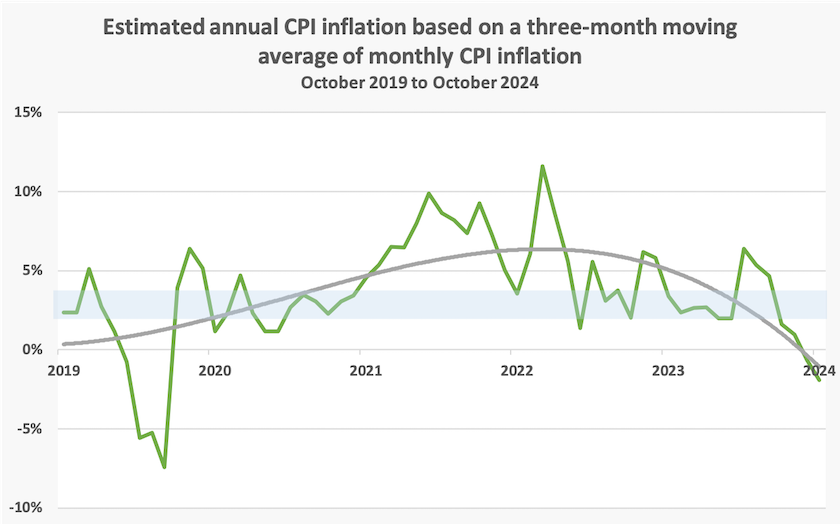
Of course there is a fair bit of noise in this indicator, but we can get a fairly good picture of its trajectory by taking a three-month moving average, shown in the graph below, overlaid with a fourth order polynomial trendline.
Annual CPI inflation, as indicated by this moving average, is minus 1.9 percent. The smoothed line suggests it is a little below zero – well below the RBA’s comfort zone of two to three percent, indicated in the grey shaded area.
That’s about the best estimate we can get of annual inflation from these figures.

Yet the media story is generally that annual inflation is 2.1 percent.
Why is there a difference?
That 2.1 percent is the change in the indicator over the last 12 months. It tells us little about what inflation is now. The three-month moving average is a better indicator, in that it considers only the data from July to October, disregarding the older data. It’s still not perfect: we have no way of knowing what inflation is now, but we get a better estimate by looking at recent data than by data going back 13 months.
To stress the point, below is the actual index number over the last five years – from just before the Covid-19 outbreak until October this year.

If that was the profile of a hill a cyclist was traversing, he or she would have stopped pedalling some time ago and by now would probably be applying the brakes.
Some journalists, particularly those who don’t want to acknowledge that the government has successfully tackled the inflation it inherited, are referring to the “Trimmed mean” figure of 3.5 percent over the last twelve months, but strangely, the ABS does not publish the trimmed mean index, which would allow for a three-month estimate to be made. But the special series that excludes volatile items also shows a fall of 0.2 percent over the last three months (a fall of 0.6 percent annualized).
What is important for those having a tough time making ends meet is that over the three months to October food prices did not move, electricity prices fell by 30.6 percent, and automotive fuel fell by 6.9 percent. The only bad news is that rents rose by 0.4 percent (1.7 percent annualized). The Australia Institute explains how rebates have helped keep electricity affordable: The latest figures show governments can (and should) reduce inflation by Greg Jericho.
The story from the right-wing media will be that Labor still hasn’t brought inflation under control because it is spending recklessly. To support this contention they will use the index over the 12 months, rather than at the last recent figures, and the trimmed mean.
But to use the cycling analogy again, the cyclist is at a higher elevation than he or she was a few km back, but is well on the way downhill.
As for the Reserve Bank, when it meets the week after next it will probably find a number in the stats to justify delaying an interest rate cut until after the election.
Future of the Future Fund
The government’s decision to modify the Future Fund’s investment mandate, requiring it to consider national priorities in its investment decisions, met with a howl of protest from the right.
Had the government imposed a “woke” mandate on the Fund? Had it directed the Fund’s trustees to invest in marginal electorates? Had it directed the Fund to divest from firms that donated to the Coalition?
Nothing of the sort. Gareth Hutchens explains the government’s directions in his post: The Future Fund's investments have always been politicised. Why pretend otherwise? The national priorities, as described in the Treasurer’s press release, are:
Increasing the supply of residential housing in Australia.
Supporting the energy transition as part of the net zero transformation of the Australian economy.
Delivering improved infrastructure located in Australia including economic resilience and security infrastructure.
These are not to be at the expense of returns.
They read like a scaled-up version of a personal superannuation fund trust deed, and they are probably lighter than some other guidance governments have given to the Fund, such as those applying to investment in tobacco and certain Chinese companies, Hutchens explains.
Writing in The Conversation – Is using the Future Fund for housing, energy and infrastructure really “raiding Australia’s nest egg”? – Mark Crosby of Monash University describes the history of the fund and the way it operates. There is an unavoidable tension between objectives to maximize returns and to prioritize certain areas of investment, he explains. He writes:
Reasonable instructions to focus on green energy investments, housing and similar alternative assets might make sense in a national sense, but in terms of government debt and the purpose of the Future Fund, they muddy the waters.
But he goes on to point out that there is little evidence that such mandates actually compromise returns.
Should a government, custodian for the community’s savings, simply seek to maximize profits, without any moral bounds?
Again, comparison with a personal superannuation fund is relevant. By strict interpretation of the law, the trustee should simply aim to maximize the investor’s financial returns, but that investor has interests other than a high income in retirement some decades down the track. A young person, thinking of the future, will probably not want to invest in fossil-fuel companies, and will see an improvement in utility by exchanging some income for a safer global environment.
The government has similar obligations to the community. The return to public investment is not just the flow of dividends and appreciation of asset prices. It also takes the form of real but non-financial returns. Housing, infrastructure and clean energy all fall into this category. The very reason that governments, rather than the private sector, invest in such things with public-good characteristics, is that the returns are not always in the form of cash dividends.
House prices
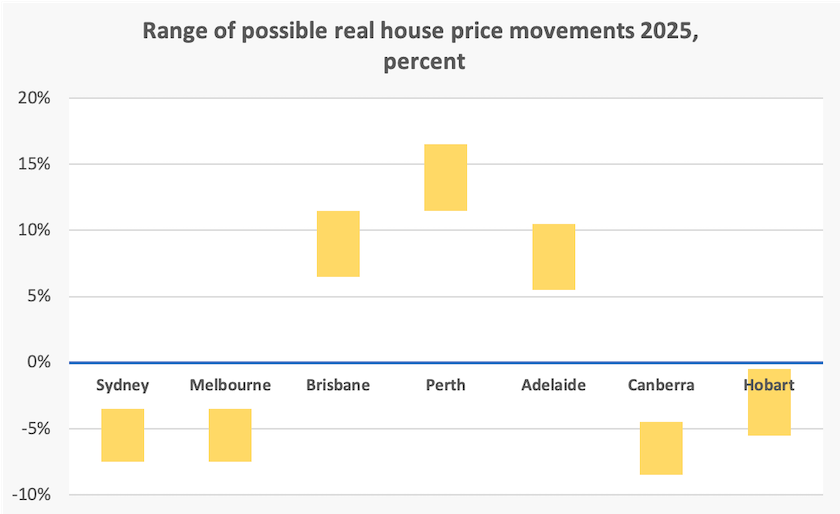
The ABC’s Rachel Clayton reports on SQM Research's latest Boom and Bust Report, which forecasts that nominal house prices in our capital cities will rise between 1 and 4 percent. The headline reads: House price predictions for 2025 show a fall in Sydney, Melbourne but Perth leads nation in value growth.
That’s an average, but there is huge variation in SQM’s forecasts. The graph below shows their range, brought to real prices assuming 2.5 percent inflation. SQM forecasts that nominal prices in Sydney and Melbourne, for example, will fall by between 1.0 and 5.0 percent, which translates to real falls between 3.5 and 7.5 percent.

These are big movements. Some sanity seems to be coming back to Sydney, where prices have been high for a long time. Melbourne prices have been falling in relation to other capitals for some time, and look like falling further.
It’s not my intention in these roundups to report on the housing market, but this one came to my attention because of the large state differences in forecast movements. With house prices a major concern to voters, it appears that the politics of housing may play out in different ways in different states.