Economics
The interest rate outlook – from Australia’s independent economists
A Macroeconomics 1 exam question:
What should a country’s central bank do when unemployment is rising, when economic growth is barely positive, when the government is running a balanced budget, and inflation, other than housing price inflation, is trending downwards?
If your answer is “cut rates fairly soon”, your response is in line with 20 of 29 independent Australian economists, whose responses are clustered around a 0.35 percent cut in February next year. Only one of those economists believes the RBA should raise the interest rate.
This is the outcome of a survey of 29 economists conducted by The Conversation, and reported by Peter Martin: Cheaper mortgages, tamed inflation and even higher home prices: how 29 forecasters see Australia’s economic recovery in 2024-25.
They are asked to make their recommendations on interest rates based on their expectations of CPI inflation, wages, unemployment and economic growth in this financial year. There isn’t much variation in their estimates. The average of their responses:
- CPI inflation: 2.9 percent.
- Wages: nominal wages to rise 3.5 percent, real wages 0.6 percent.
- Unemployment: to rise from 4.0 percent at present to 4.4 percent.
- Economic growth: to rise from 1.1 percent to 1.3 percent by the end of the year.
Their expectations of inflation, wages and unemployment are pretty much in line with the Treasury estimates in the budget, while they are somewhat less optimistic on economic growth: the budget papers forecast 2.0 percent growth this year. What they see is an economy in a low-growth phase of the business cycle, certainly not one requiring tight fiscal or monetary settings.
The 3.5 percent nominal wage growth should bring a little relief to households with high mortgages. Economists, who habitually convert everything to real terms, tend to forget that inflation and associated nominal wage growth work wonders on reducing the real value of debt, and have played a strong role historically in reducing public and private debt in Australia.
Included in the panel of economists is Luci Ellis, who was Assistant Governor (Economic) at the Reserve Bank until October last year and is now with Westpac. She is one of the four economists most enthusiastic about lowering rates, going for a cut of 0.75 percent, in stages, by the middle of next year.
It’s notable that these economists have made their assessments and recommendations after the ABS published the CPI Indicator on June 26. Many journalists, under pressure to write, reported that the CPI Indicator showed a rise in inflation, setting off a round of speculation that the next move by the RBA will be to raise rates. Confirming the power of early estimates, even when they are rough, this expectation has been a common belief, sending the $A a little higher, and fuelling a scare campaign by the opposition.
Another piece of sloppy economics doing the rounds is an assumption that the tax cuts and energy bill relief will have an immediate effect on inflation. But they don’t come all at once. For an average wage and salary earner the tax cuts are about $40 a week, and the electricity bill relief will be noticed only by those who read their bills carefully, whenever those bills come.
Besides these estimates on CPI inflation, wages, unemployment and economic growth, the economists were asked to report on their estimates of house price movements in Sydney and Melbourne. They exhibit a wide range of estimates, but on average they believe that house prices will rise more strongly in Sydney than in Melbourne.
And from the Reserve Bank
The RBA has published the minutes of their 17-18 June meeting. In their assessment of the economy they have an “on the one hand, on the other hand” style. It’s not clear whether this is deliberate vagueness, or a reflection of differing perceptions by board members. The general tone is that they find consumer spending to have been stronger than they had expected, while economic growth has been weaker. There is a sentence “Members noted that wages growth had likely passed its peak for the current cycle”. Does that mean “some members” or the board generally?
On Wednesday the ABS released retail trade data for May, confirming that consumer spending is rising, but only for necessities. That means consumer demand is unlikely to be influenced by a rise in interest rates.
The RBA, however, is undeterred in its missionary zeal. Its final sentence reads “Returning inflation to target remains the Board’s highest priority and it will do what is necessary to achieve that outcome”. Nothing about employment, the distribution of the burden of rate rises, house price inflation, or economic growth, and no explanation justifying its inflation monomania.
How did an economic optimist become the Reserve Bank’s new deputy governor?
We might wonder how Gorbachev became General Secretary of the USSR Communist Party, or how Bridget Archer managed to get Liberal Party preselection.
Another difficult-to-explain appointment is Andrew Hauser as Deputy Governor of the Reserve Bank. He’s an optimist in a profession described by Thomas Carlyle as “the dismal science”, and central banks generally go for the type of people who find the Franciscans too indulgent.
The ABC’s Michael Janda reports on a speech Andrew Hauser gave at an economic forum, in which he provided a refreshingly upbeat assessment of the Australian economy. (I covered it briefly in last week’s roundup because he subtly reminded everyone that they were making too many rash predictions based on the latest monthly CPI Indicator.)
One explanation for Hauser’s assessment is that he has come from the Bank of England, the UK’s central bank, and finds the contrast with the UK striking. Few Australians realize how far the UK has sunk into poverty since, and largely as a consequence of, its decision to leave the European Union.
The other reason for his optimism is the way Australia is set up to take advantage of its extraordinary opportunity in a world looking for clean energy and a range of critical minerals needed for an energy transition.
It’s reasonably well established that natural resource abundance provides a disincentive for investment in human resources. This is known as the “resource curse”. Resource-poor countries like Japan and Singapore have had to rely on their human capital to prosper, while history books present many examples, from Argentina through to Nauru, of resource-rich countries that failed to invest adequately in their human capital.
Janda’s article includes a scatter diagram, produced by the Reserve Bank, showing a distinct negative correlation between countries’ commodity capacity and human capacity, confirming this relationship. But the good news is that Australia is a distinct outlier on this diagram, as one of a small number of countries with high commodity dependency and high human capacity.
Making it in Australia in a tricky world order
It is easy to dismiss the government’s Future Made in Australia as a retreat to protectionism, but that’s to misunderstand the policy – it isn’t about Holdens and Pelaco shirts – and to misunderstand the trade and security environment Australia now faces. It’s not the liberal world order of the later years of last century.
From the time of the Bretton Woods agreement in 1944, the “developed” world was on a path to globalization, with freer trade, freer cross-border investment, and floating exchange rates, backed by a rules-based order. Although Australia didn’t throw itself into this movement until the 1980s, with the Hawke-Keating reforms, we were among the main beneficiaries.
That order has given way, not to disorder, or to a 1930s round of competitive protection, but to what Treasury Secretary, Stephen Kennedy, in a speech to the United Sates Studies Centre, calls a “more contested, more fragmented and more challenging global environment”. Just as the “western” powers, particularly America, dominated world trade and set the rules in the Bretton Woods order, the “engines of global growth have shifted from west to east”. Kennedy goes on to say “the move to a more multipolar global order has brought with it a sharpening of geostrategic competition and a far more contested set of global rules, norms and institutions”.
In this world we cannot assume that the path leads to a benign environment for trade and commerce. Ross Gittins outlines this changed world in his comment on Kennedy’s speech: How and why the tide of globalisation has turned.
It’s in recognition of the complexity of this environment that the government has cast its Future Made in Australia policy. This is not a return to protectionism, or an attempt to shift our trade relations away from China, back to a late twentieth century pattern – an approach Kennedy’s US counterpart Treasury Secretary Janet Yellen calls “decoupling”. But it does involve “de-risking and diversifying, by investing at home and strengthening linkages with allies and partners around the world”. to use Yellen’s words.
The challenge for government will be determining what should be protected – not to provide “jobs” as was the case in earlier times, but in the interest of national security. To quote Kennedy:
As a medium-sized open economy, it is vital that Australia retains access to a wide range of markets and cutting-edge technologies. However, there are a subset of systems, goods and technologies that are critical to the smooth operation of our economy and the security of our country. Systems that are vulnerable to interventions and where a disruption could impact lives and threaten our national interest in a time of conflict. These parts of the economy cannot be left to the private sector alone and there is a clear role for government in regulating their operation and ownership. This is often described as the ‘small yard, high fence’ strategy, where a strong set of protections are put around a small number of critical economic activities.
The illusion of housing wealth is working against monetary policy
Isn’t the Australian economy marvellous! In only three months, from December last year to March this year, household wealth increased by $431 billion, according to ABS National Accounts.
If you dig into those accounts you will see that $218 billion of this gain resulted from a higher value of land and dwellings, and $181 billion from the increased value of superannuation funds and shares. In contrast the value of bank account deposits and other financial assets – the money we can go out and spend today – hardly moved.
Let’s look at that $218 billion in increased house values. About 6 million Australians own, or are paying off, houses. A simple division reveals that their individual wealth rose by about $35 000 on average.
That arithmetic is OK, but the conclusion is virtually meaningless.

If you don’t maintain it, value in use falls
Unless you are about to sell up and move from Australia to Albania or Iran (countries with very affordable real estate), or to move within Australia from Double Bay to Broadmeadows or West Wyalong, you enjoy no benefit from this increased value. It’s an increase in what economists and philosophers call “value in exchange”, which holds some meaning for stuff we may be inclined to buy and sell, including so-called “investment properties”, but for most homeowners their houses aren’t on the market, and if they are it’s probably because they’re buying another, or have just died.
By contrast, what economists and philosophers call “value in use” – the value we gain from shelter, amenity, comfort – hardly changes, and unless we are particularly diligent with maintenance, that value deteriorates over time.
When the market value of our house changes in line with property prices generally it should not result in our feeling more or less prosperous. It’s only inflation (or deflation). But because of what economists call the “wealth effect”, it does change our feeling of wellbeing. For many, if the market value of their house rises they feel more relaxed to go out and spend.
That means, for those people who have little or no mortgage debt, and who are subject to the wealth effect, tighter monetary policy has no effect in reducing their spending. In fact, to the extent that tight monetary policy drives up housing prices, it encourages them to go out and spend. It’s an example of the way monetary policy works against its own objectives.
The ABC’s David Taylor describes this mechanism in his post “Property speculators paradise”, Australian households earning $25,000 for doing nothing.
This effect is particularly pernicious because it applies not only to the houses we live in, but also to semi-liquid assets, including shares and investment properties. The market value of such assets is inflated because of the generous concessions to capital gains, while the combination of a 50 percent discount and the abolition of indexation provides a strong incentive to holders to cash them out.
Those who have investments and no significant housing debt – mainly older Australians – are the people most likely to be influenced not only by the wealth effect, but also by these incentives to liquidate assets, and to go out and spend.
David Taylor quotes Saul Eslake on the capital gains concessions, which he calls “one of the dumbest tax policy decisions of the past 25 years”. Those concessions, enacted in 1999 when the Howard government let the banking sector write Australia’s tax policy, have been one of the main drivers of the subsequent housing bubble.
The other main driver of inflated asset prices – real estate and shares – has been the Reserve Bank’s interest rate settings from 2012 to 2022, when it kept lowering nominal interest rates, allowing real rates to fall to zero and below zero by the end of the period. Had we not been visited by the pandemic the Reserve Bank may have started tightening monetary policy earlier, but the RBA kept rates down for far too long.
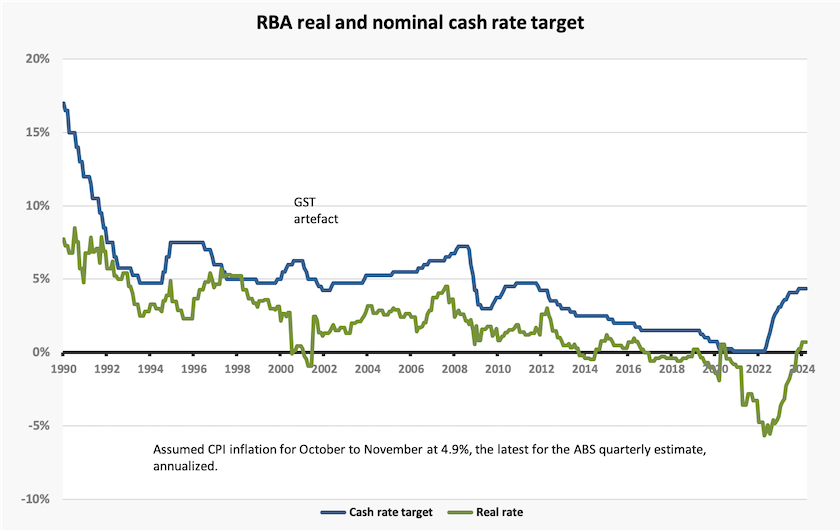
This surfeit of cash contributed to asset price inflation. Real estate and share prices have been rising strongly, apart from interruptions during the pandemic. Rising asset prices have contributed to wealth inequality. Australians may be angry at the Reserve Bank for the rapidity of its reversal of its loose policy, particularly when it had given the impression that low interest rates were to endure for some time, but the real economic damage had already been inflicted.
This economic history is described in more detail in a post by the ABC’s Ian Verrender, who explains how it has driven debt and wealth inequality, and is now playing out to constrain options for fiscal and monetary policy: Why property and stock markets are thumbing their noses at rate hikes.
Although Australia suffered the economic burden of a Coalition government over these years of loose monetary policy – a government that neglected the economy’s deteriorating supply-side capacity and distorted the taxation system – the RBA’s loose monetary policy cannot be put down to the Coalition’s stupidity. Independent central banks, including Australia’s, were practising much the same policy. Apart from jaded old academics, no-one complains about rising-asset prices, and the conventional economic wisdom is that monetary policy is concerned only with inflation in the flow of produced goods and services, rather than asset price inflation.
That conventional wisdom needs to be re-visited, because monetary policy, as it has been applied since the 2008 financial crisis, has not been working.
Your next electricity bill explained
Apart from realizing that their electricity bills are almost certainly higher than they were a few years ago, and grizzling to reporters with roving microphones, most people don’t do anything about their electricity bills, either individually or collectively through public policy.
Consumer understanding isn’t helped by the Coalition parties, promulgating the lie that higher prices are due to the government’s policies on renewable energy. Nor are they helped by journalists who confuse electricity bills with electricity prices, or who patronize consumers by talking about outlays per year for the typical household rather than prices per kWh. (Imagine if journalists referred to gasoline prices only in terms of $ per year for the typical motorist, rather than price per liter.)
The ABC’s Tom Mercer explains what is happening to power prices this financial year, which includes changes (reductions in most states) in the benchmark electricity price, the Commonwealth’s $300 handout, and changes in various states’ consumer subsidies. There will also be some changes for households with really big rooftop solar systems. Solar charges, new prices and government handouts mean your power bill will change from today.
In this presentation he acknowledges the contribution of Richard Foxworthy, who runs the energy-saving site Bill Hero.
Mercer includes an informative chart of the benchmark power prices in the Ausgrid area (basically Sydney and Newcastle) over the last four years, broken into its components. It would have been more informative if it were in cents per kWh, and if it were in CPI-adjusted prices, rather than nominal prices, but it still gives a sound idea of the relative contributions of different parts of the supply chain, revealing clearly that the cost of generating electricity is only a small part of your blll, and it’s falling. The rest of your bill covers the cost of getting the electricity to your house or business, undeserved high profits to the owners of poles and wires, and support for a high-cost technologically backward billing system.
In order to help explain what has been happening with power prices, I re-present his chart in “real” terms (adjusted to 2023-24 prices), with a small re-ordering of the elements to put the wholesale component – what you pay for the electricity as it leaves the solar farm, wind turbine or power station – at the base.
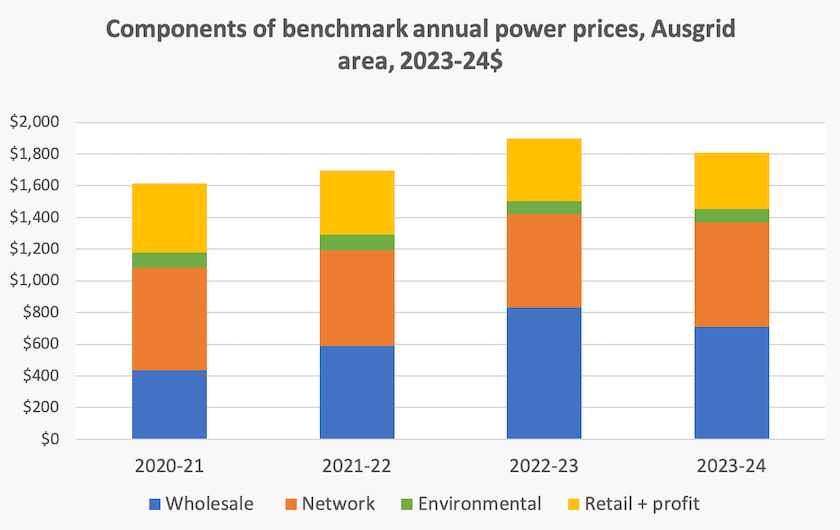
Note that the wholesale price rose steeply between 2021-22 and 2022-23, before falling substantially last year.
The story in this chart is mainly about the rise in world energy prices following Russia’s invasion of Ukraine, and the subsequent expansion of renewable energy in the last couple of years. We didn’t notice this in our bills, however, because regulated network costs have risen substantially, absorbing savings in electricity costs. For that we can blame the Reserve Bank, because the return to the largely privately-owned transmission and distribution networks is linked by formula to prevailing interest rates. And on top of this we have the “retail + profit” component. That is what we pay to the coupon-clippers whose task is to smooth out the hour-to-hour fluctuations in wholesale prices and read our meters – functions that used to be done without fuss and at low cost by the old state-government owned electricity utilities.
Although the cost of generating electricity is falling, we are paying too much for electricity. Much of this excess stems from the ill-advised decision late last century to privatize the state-owned utilities when the National Electricity Market was established. The regulated network businesses, natural monopolies operating fixed assets in a mature industry with an assured demand and with virtually no market risk, are allowed a generous and unearned profit. And the distributors do even less, other than presenting an impression of competition, while locking consumers into technologically-primitive metering methods.