GDP, inflation and incomess
National accounts – a slow recovery in a structurally weak economy

Undder the pump to quote the treasurer
The March quarter national accounts reveal a miserable 0.1 percent economic growth in the March quarter. This follows growth of 0.2 percent and 0.3 percent for the first two quarters of the 2023-24 financial year. It’s unimpressive, in a country that once considered four percent annual growth in GDP as normal, but it is in line with government expectations that growth this year will be only 0.75 percent. If growth for the June quarter comes in at 0.15 percent that forecast will have been met.
The government expects there to be a slow pickup in growth – 2.0 percent for the coming year and a slow rise after that. Economic reform takes time, as the government deals with the still-resonating local and global shockwaves of the pandemic, and decades of lazy economic management by Coalition governments who ignored Australia’s need for economic structural reform.
The more dismal story is revealed in GDP per capita shown in the graph below, which is a first-order indicator of the economy’s capacity to sustain material living standards, and therefore an approximate representation of the economy as people experience it. Our per-capita GDP has been falling for the last 18 months, and is now well below the trend over 2014 to 2018 (red dashed line). Note that it started to fall below the trend before we were hit by the pandemic.
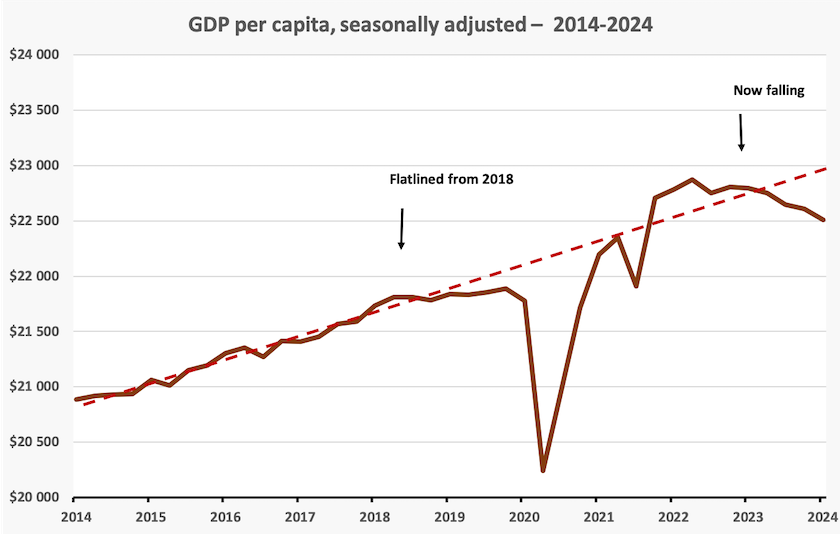
One interpretation of that graph is that we’re only $500 below the trendline, but as other data shows, young people in particular are having a tough time in an overpriced housing market.
Some of this stress is revealed in a graph of the household savings ratio. shown below.
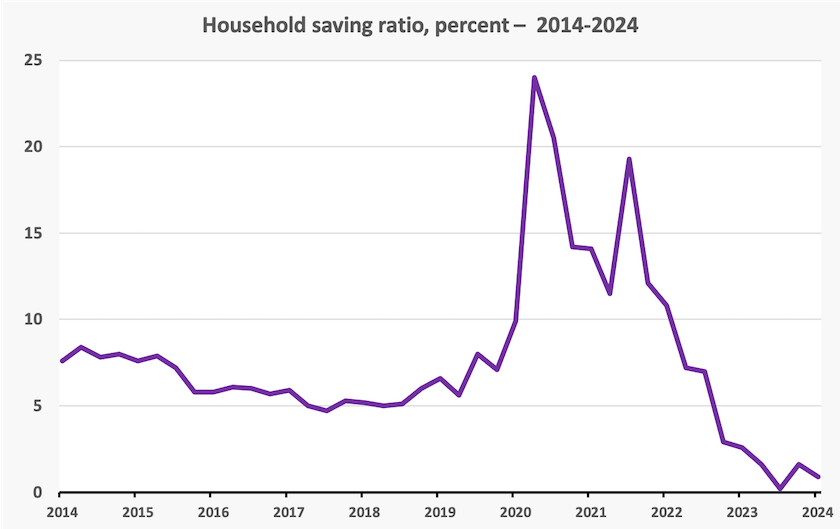
The simple story is that because of income-support payments, and the lack of opportunities to spend, we saved during the pandemic and have been spending down our savings since. There is now speculation about whether the the coming tax cuts, energy rebates and rises in minimum wages will be saved or spent.
But the story is more complicated. The Commonwealth Bank Cost of Living Insights Report shows a clear relationship between age and spending patterns. Older people, particularly retirees, are spending heavily, including on discretionary items, while younger people are cutting back, even on essentials. Cruise ship companies, for example, seem to be enjoying a bonanza. Politicians and journalists keep talking about a “cost of living” crisis, but it would be more accurate to talk about a worsening problem in income and wealth distribution.
ASIC reports that more than 5 million Australians are struggling to meet loan and debt payments. Financial stress is falling most heavily on “Millennials” (now aged between 28 and 43), who are facing the peak of financial demands, whether they are renters or home owners with a mortgage.
ASIC finds that their hardship is not only in financial terms. It is also about people’s sense of shame and embarrassment about their debt problems. Many would sell their belongings rather than seek available financial assistance to relieve the burden of debt. Similarly, the ABC’s Adam Harvey reports an increasing trend for people to raid their superannuation accounts to pay for dental treatment as an example of some people’s desperation.
Even before the shock of the pandemic our savings rates were low. In the 1970s and 1980s savings rates were typically between ten and twenty percent. Australians had more capacity to save for home deposits, to buy cars for cash, and to pay for non-insured health needs. Without that buffer, most Australians now find life to be more precarious than those of previous generations did.
Inflation – why is the Reserve bank peddling false economics?
A $300 energy rebate isn’t going to make much difference to the welfare of most Australians, but it raises basic issues about what we understand about inflation, and whether the Reserve Bank is being straight with the community about inflation.
The government says the rebate is not inflationary, because it will help keep the CPI in check. As David Crowe states in the Sydney Morning Herald – High voltage: Jim’s $300 power play to fight inflation – “Treasury estimates that the energy bill relief and other measures will cut the rate of inflation by 0.75 percentage points this year and 0.5 percentage points next year”.
Economic purists differ, however. As a fiscal measure the $2.7 billion to be spent on the rebate this year adds to aggregate demand and therefore to inflation.
Both lines of argument are reasonable. Yes, the rebate will lower the CPI, as similar rebates have done over 2023, confirmed in the electricity component of the March quarter CPI. But the CPI is only one indicator of inflation, and the macroeconomic model of the economy emphasises that over-stimulating demand is inflationary.
The Australia Institute’s Greg Jericho, in his article No, the budget is not inflationary, explains economists’ macroeconomic concerns, but he dismisses them, because in his assessment the budget is not stimulatory enough. He also points out, in line with findings in behavioural economics, that while the rebate will make people better off, it will simply result in electricity bills being lower than they would have been without it. If it came as a $300 deposit into their bank accounts, people would be more likely to see it as a windfall and go out and spend it, which would give an immediate boost to demand.
The Financial Review’s Stephen Hamilton acknowledges that the rebate will have an inflationary effect through its impact on demand, but because many wage claims and contracts are linked to the CPI, it will have a real effect in reducing inflation. This effect, which arises from the prominence of the CPI as an accepted indicator of inflation, is not in the textbooks.
In any event, because of the way the budget works, if the government were not to spend $2.7 billion on the rebate it would probably be spending it on some other program. That’s because its starting point is the planned fiscal surplus or deficit – a deficit of $28.3 billion or 1.0 percent of GDP for the coming fiscal year. From there on the bargaining process between ministers is more akin to what happens in a bazaar than any rational consideration of economic needs.
The government’s fiscal policies are actually more sophisticated than that, explains Gareth Hutchens in a post If inflation is falling, why are prices of essentials still rising so quickly? , where he explains analysis done by Westpac economist Jason Coombs. Coombs observes that households are cutting back on discretionary spending, but are still spending on essentials. It’s easier to cut back on cinema tickets and the $4.50 coffee than it is to cut back on car registration and a leaking roof.
That’s one reason monetary and fiscal measures to suppress aggregate demand don’t work – we’re going to find some way to register our car and fix our roof. But because of a lopsided structure of our workforce, which Coombs explains, skills shortages result in continued rises in the price of essentials. The government’s fiscal measures have been wisely targeted at easing the price of certain essentials, including pharmaceuticals and electricity. Such targeting is not available to the Reserve Bank which has only the big instrument of interest rates.
Arguments about the inflationary impact of the $300 energy rebate once again raise the question of why policymakers and journalists are fixated on the CPI. After all it’s only one indicator of inflation. One other indicator, which considers price changes throughout the economy and not just in households, is the GDP implicit price inflator. Like the CPI it has its limitations and biases, but it is comparatively unaffected by changes in consumption rebates and taxes.[1]
The latest update to the GDP implicit price deflator was published in the National Accounts last week, and the graph below shows it over the last ten years (blue line), on the same scale as the CPI (red line).[2]
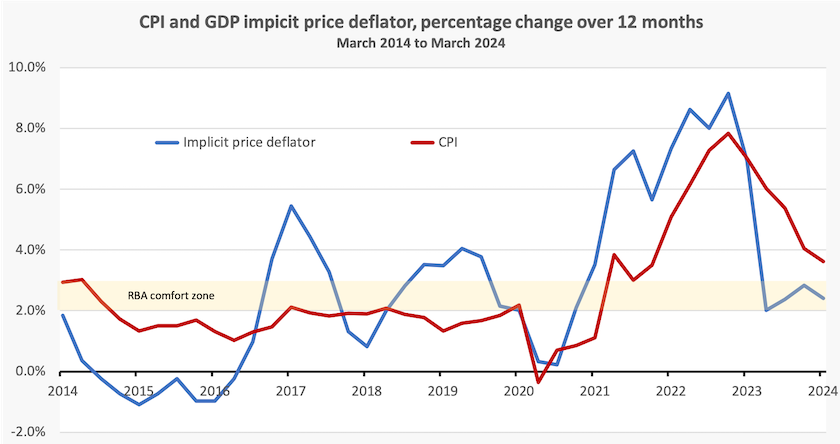
It appears that the implicit price deflator, over the last four years, has been leading the CPI by about six months, and is now well within the RBA’s comfort two to three percent comfort zone.
If the RBA has some leading indicator of inflation, surely it should heed it. As the ABC’s Michael Janda points out in a post about monetary and fiscal policy in the 1990s, the RBA has a history of reacting too slowly when the economy starts to turn down. A leading indicator, or at least an indicator with less lag than the CPI, should help in overcoming that tendency.
This begs the question why the RBA, in its public announcements, puts sole emphasis on the CPI. The governor and the staff of the RBA are some of Australia’s most able economists. They would be well aware of all the limitations and biases in particular index numbers, the difference between once-off price adjustments and accelerating inflation, the different elasticities of demand in different parts of the economy, and much more. Yet in their communication with the public they peddle the simple message that nothing is more important than bringing the CPI back to an arbitrarily-determined comfort zone, without any explanation other than an unqualified assertion that inflation is bad.
1. Statistics texts point out that the CPI uses a fixed-base “basket” of goods and services, while national accounts deflators use a changing-base basket. The former is a Laspeyres index, which theoretically has a bias to overstatement because there is some substitution between periods, while the latter is a Paasche index, which has a bias to understatement, because some substitution is welfare-depleting. In fact, over an extended period in Australia, the CPI and the GDP implicit price inflator average out to around the same values. ↩
2. There are two GDP index numbers published in the National Accounts – the chain price index and the GDP implicit price deflator. The difference is explained in an ABS information paper on price indexes. I have chosen the implicit price deflator for this graph, because it is less influenced by prices set in commodity markets. In fact the GDP deflator shows even lower inflation than the chain price over the last three quarters. ↩
Wages – an improved wages-profit share is still holding up, but real gains await productivity improvement
Developments in the wage-profit share of income are shown in the graph below. There was a slight move towards profits in the March quarter, but wages are still holding up. Nevertheless at 52 percent the wages share is sill well short of the levels of the high fifties and low sixties in most the 1970 – 2000 period.
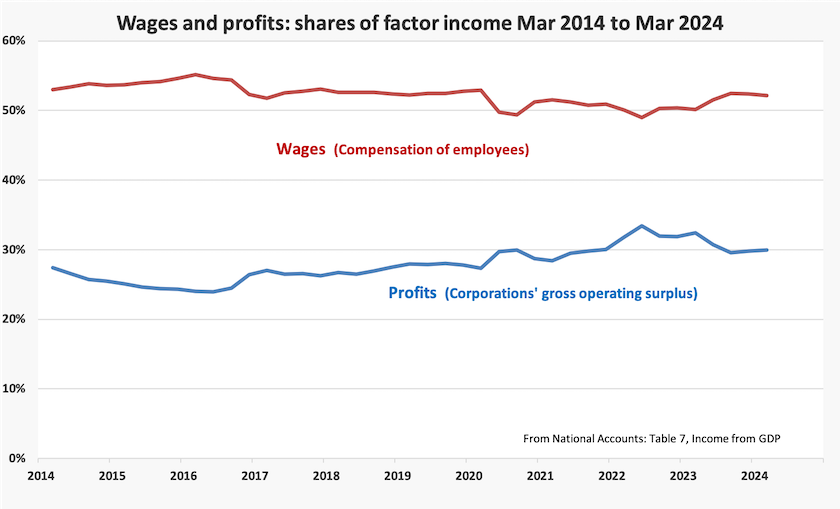
Unlike the Coalition, which deliberately pursued a low-wage policy, the present government is seeking to lift real wages – in the short term by raising wages for the least-well paid, and in the longer term by improving productivity so that all can enjoy higher incomes.
The Coalition is behaving in line with its established pattern, suggesting that the Fair Work Commission’s decision to lift award wages in line with inflation will inflict ruin on the economy. Peter Martin writes in The Conversation: Spare us the talk about a wages explosion. There’s nothing wrong with lifting Australia’s lowest wages in line with inflation. John Buchanan, one of Australia’s most respected experts on labour economics, also writing in The Conversation, explains the Fair Work Commission’s decision in detail: Low-paid wages up 3.75%, with more to come for childcare and health professionals. This rise only partially makes up for an accumulated reduction in real wages.
The Fair Work Commission’s determinations are about conditions prescribed by law. The ABC’s Bronwyn Herbert and Maryanne Taouk remind us that wage theft is still rife. It is probably most common among small businesses employing recently-arrived immigrants, but there have been many cases among big companies and institutions, some because of less-than-zealous attention to award provisions, and some because of exploitation by franchise holders in industries such as fast food.
The government’s policies around immigration reform should go some way towards cleaning up wage theft. But sustained improvement in real wages depends on improving productivity. The national accounts gross productivity indicator, GDP per hour worked, shows some early sign of improvement as shown in the graph below.
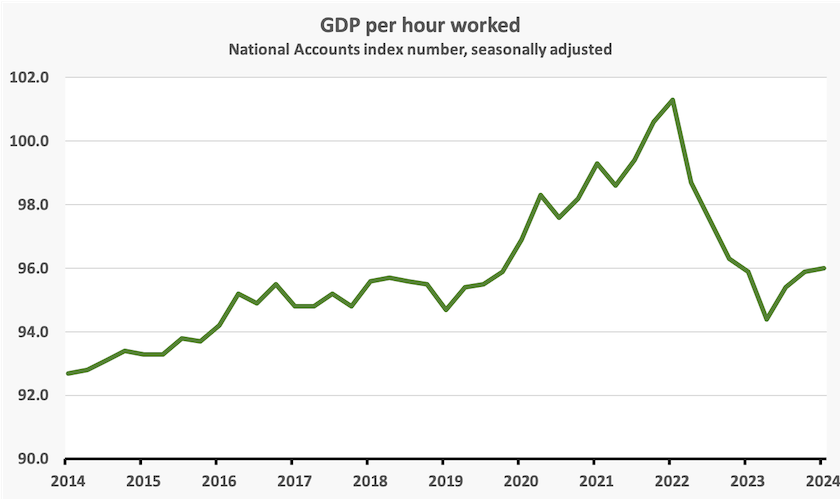
We should not be distracted by the apparent rise in productivity during and immediately following the pandemic. These are artefacts, resulting in part from income-support payments during the pandemic and a surge in deferred expenditure as we resumed more-or-less normal life.