Economics
Housing supply isn’t going to improve any time soon
The National Housing Supply and Affordability Council, a body established last year “to build an evidence base and provide expert advice that will support policy making to improve outcomes across the housing spectrum”, produced its first report: State of the housing system 2024.
It confirms and consolidates what we already know about housing. There’s a supply shortage, aggravated by “the resumption of migration at pace, rising interest rates, skills shortages, elevated construction company insolvencies, weak consumer confidence and cost inflation”.
Supply will fall short of demand for the next two years, and the accumulated backlog of unmet demand will not be cleared for at least six years. Supply of social housing, in particular, is falling further and further behind.
Most press reports haven’t gone much past these headline figures, but the Report’s 200 pages of analysis go much further: they cover housing in all its imaginable social and regional dimensions – for example with a detailed analysis of the way our transition to a service economy has pushed up demand, and therefore prices, in inner-city regions.
The authors are clear about their values, which are somewhat different from those who write about housing as a financial instrument:
We’re talking about homes, not assets. Access to shelter is a basic human need and right. The lack of a secure home, whether rented or owned, is a source of significant stress for families.
Using severalindicators – physical and psychological – they analyse how that stress is manifest among renters and mortgage holders, and for those with high and low incomes.
One important finding, which the media seems to have almost entirely overlooked, is the Report’s description of the construction industry as one in dreadful shape structurally. It is characterized by fragmentation, a high rate of entries and exits, a low rate of innovation, drawn-out construction times, long-standing skills shortages, all contributing to low productivity. “Multifactor productivity in the construction industry has fallen by 0.2 per cent per year since 1989–90”. That’s an extraordinary finding: in many industries productivity sometimes stalls, but rarely does it go backward.
The authors take care not to step on too many political toes. Taxation arrangements are mentioned only in passing and are supported by a reference to Ken Henry’s statements, as if they are nervous about drawing any conclusions themselves:
The range of tax settings can affect owner-occupiers, investors and renters in different ways. Overall, however, the tax system favours owner-occupied housing, which supports housing demand (Henry, et al., 2009).
They mention one proximate cause of the industry’s fragmentation and poor productivity performance – fixed price contracting:
The sector’s low productivity reflects fragmentation of the industry and constrained access to working capital that limits the scope for investment in new technology and innovation to drive productivity growth (Australian Constructors Association, 2023). These factors combine with the dominant fixed-price contracting model to leave the many small firms in the industry focused on short-term production rather than making significant long-term investments. However, client demand for innovation and regulation introducing new building standards could bolster productivity.
The report’s authors don’t go into one more basic contribution to this dysfunctional industry structure. That is a failure of monetary and fiscal policies to stabilize the economy. Housing, and construction generally, has always been the economy’s shock absorber, experiencing the worst swings in the economic cycles. It is going through one now, resulting from the Reserve Bank’s demonic obsession with the ABS CPI figures. That instability does not allow firms to grow and invest in equipment, research and training, does not encourage people to develop sector-specific skills, and does not make for trusting relationships between financiers, contractors, employees, and customers.
Australia once had a well-developed welfare state – remember?
Almost entirely missed by the media was the 2024 Report of the government’s Economic Exclusion Committee, a body established by this government to provide advice on boosting economic inclusion and tackling disadvantage.

It has been set up not only to provide general policy advice, but also to provide non-binding pre-budget advice.
It has five priority recommendations in this report:
Substantially increase JobSeeker and related working age payments and improve the indexation arrangements for those payments.
Increase the rate of Commonwealth Rent Assistance.
Create a new employment services system to underpin the goal of full employment and ensure a more positive focus on supporting Australians seeking work.
Implement a national early childhood development system that is available to every child, beginning with abolishing the Activity Test for the Child Care Subsidy to guarantee all children access to a minimum three days of high-quality early childhood education and care (ECEC).
Renew the culture and practice of the social security system to support economic inclusion and wellbeing.
The ABC’s Gareth Hutchens is one of the few journalists who has brought this report to our attention: Why are Australia's unemployment payments so inadequate? Experts say they have been deteriorating for decades.
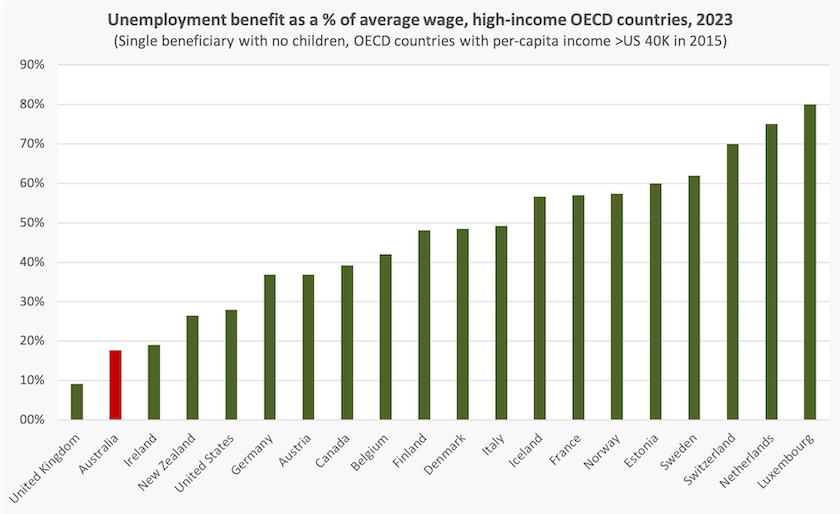
Our benefits for the unemployed are among the meanest of all high-income countries, Hutchens points out. The graph below, compiled from the OECD Benefits and Wages database, dispels any myth that our benefits are generous: even the Americans do better than we do.[1]
The report’s authors remind us that the language at times used by politicians to refer to the unemployed as “dole bludgers”, “welfare cheats”, “rorters”, “leaners” and so on has influenced our perception of the unemployed as unworthy of support, even though the evidence of welfare fraud and evasion of mutual obligation requirements is “miniscule”, Hutchens reports. That language is not used to describe aged pensioners, whose benefits are substantially higher than those paid to the unemployed.
We should also remember that it is almost specific government policy to sustain a certain level of unemployment as an aspect of its monetary and fiscal settings – the “reserve army of the unemployed” to quote an economic philosopher whose ideas have gone out of fashion in the brave new world of neoliberalism.
Ever since the time of the pandemic, when, for a short period, our rate of unemployment benefits (bearing that awful name “JobSeeker”) was adequate to support a dignified living standard, there have been voices calling for a higher rate of payment. Just last week 300 women from business, unions, philanthropy, academia and the community sector have written to the prime minister, calling for the government to raise the rate of Jobseeker and Youth Allowance to provide economic security for women leaving situations of violence.
1. This is not exactly the same graph as is shown in Hutchens’ article, which appears to be taken from an OECD publication, but it is drawn from the same database. The results one obtains from that database depends on a number of features, including people’s age and the duration of unemployment, the latter being one reason the US can show up as more generous than Australia. Their benefits taper off quickly. ↩
Support for university students and graduates
Student debt
Indexation of benefits, or in the case of HECS, indexation of debt, is always tricky. In pure theory indexation of student debt to inflation is equivalent to giving someone an interest-free loan, but if one’s capacity to pay does not keep up with inflation, the debt and repayments become burdensome. This is particularly so for young people facing housing stress.
Writing in The Conversation – The good news is the government plans to cancel $3 billion in student debt. The bad news is indexation will still be high – Andrew Norton of ANU explains how the government’s policy will work. The outstanding debt is to the CPI or the Wage Price Index, whichever is lower. And it will be backdated for one year. That backdating will result in the debt rising by 3.2 percent (Wage Price Index) rather than 7.1 percent (CPI) – a credit of $780 in the account of someone with a $20 000 debt.

They’ll be free of debt sooner
Norton explains the mathematics of the indexation process, which uses a “strange formula” that wouldn’t get a pass mark in a statistics exam, but which comes close to the usual method of indexation. His own preference is the lower of the CPI or 4.0 percent – which would give people the certainty of some upper bound.
For the coming year, while we know that the old CPI-based formula would result in a 4.7 percent rise in people’s debt, the Wage Price Index for March will not be published until next week. Norton reckons it will be around 4.3 percent, resulting in a modest saving of $80 in the coming year for the same person with a $20 000 debt.
On the ABC Drive program Bruce Chapman, the architect of the original HECS system and its associated income-contingent repayment system, discusses the politics of the changes: $3 billion in student debt 'wiped out' in HECS overhaul. In the short run, because they are book entries changing the level of outstanding debt, the changes will have no effect on graduates’ or the government’s cash flows. But they will result in people finding that they eventually pay off their student debt a few months sooner than they would have, had the scheme not been changed. One caller to the program also said that a lower student loan liability would help improve graduates’ credit rating.
Chapman is also asked for his view on the 2020 changes to course fees, under the Coalition’s poorly-advised “jobs ready” changes. Without going into detail he is critical because of their unfairness and clumsy design.
Payment for work placements
Unpaid work experience, up to six months in some courses, is a requirement in many professional degree programs, including teaching, nursing and social work, all professions with low incomes compared with the incomes of other graduates, and dominated by women.
Deanna Grant-Smith of the University of the Sunshine Coast and Paula McDonald of the Queensland University of Technology, writing in The Conversation, explain how the Commonwealth assistance will work: What does the new Commonwealth Prac Payment mean for students? Will it do enough to end ‘placement poverty’?. It’s not generous – $319.50 a week (why not $320?) and it’s means tested. It should, however, reduce the rate at which students, financing themselves with part -time or even full-time work, drop out of courses because they cannot afford to take a break from paid work.
Education Minister Jason Clare explains the government’s thinking behind the initiative – Government to tackle university “placement poverty” – on the ABC (9 minutes). He is particularly concerned to see that students have the means to complete their degrees.
The government is aware that work experience is required in some other courses, such as veterinary science, psychology and medicine, but it has chosen to prioritize teaching, nursing and social work, and is looking at other sources of funding for these other courses. (Although the minister does not mention it, it is relevant that most people in teaching, nursing and social work are directly or indirectly on government payrolls. It wouldn’t make sense to require state education and health departments to fund placement support, and would cause a political row in Commonwealth-state relations.)
On the ABC program $3 billion in student debt 'wiped out' in HECS overhaul, after Bruce Chapman’s discussion of HECS relief, Annie Butler, Federal Secretary, Australian Nurses and Midwives Association, describes the initiative as “a really terrific start”, and explains the costs faced by students doing placements – which often involve travel and arrangements to find special accommodation.
Some argue that students doing placements will still face difficulties. That is correct: $8 an hour is hardly a living wage. Student groups have been quick to criticize the government for setting such a low rate of payment. But at last we have a government that is doing something to address the problem. When it was in office the Coalition did nothing.
It’s the economy (and housing), stupid
That’s the title of a major survey of Australians’ views of the economy and the housing market, conducted by the ANU’s Centre for Social Policy and Research.
We have been experiencing more and more financial stress over the last four years. Unsurprisingly that stress is greatest for those with the lowest incomes, but Australians in every income quintile express about the same rise in stress.
We have responded by cutting spending in many areas, including “essentials”: 62 percent of respondents say they have been cutting spending on groceries and essential items.
Our satisfaction with life has fallen and our outlook has become more gloomy.
The ANU research is about Australians, but it resonates with research conducted in other prosperous countries.
For the last four years we have become less satisfied with the direction of the country. There was a jump in satisfaction in mid-2022, when we voted Morrison’s Coalition government out of office, but our satisfaction levels are now back to the low levels where they were before the election. Our satisfaction with our own lives has followed a similar trajectory.
Confidence in government has shown a slightly more complex pattern. Confidence in government rose strongly as governments took strong action on the pandemic, but fell as we adjusted to a post-pandemic life. It rose sharply after the election, but started falling from late 2022. (That pretty well aligns with voter support for the government, which shot up after the election, but which has now fallen back to the levels at the election.)
Over the longer term, the last 15 years or so, we have become more concerned about government debt – unsurprising in view of the debt accumulated during the pandemic – and we have become less demanding on governments to spend on particular services.
But the perennial demands for public spending are still strong – more than 90 percent of respondents believe governments should spend more on health; more than 60 percent believe governments should spend more on the environment, education and age pensions. We are less enthusiastic about spending on defence, culture, the arts and unemployment benefits (all <40 percent.)
On housing the results are surprising at first sight. To quote:
Despite the financial pressure that many households are under, there is a generally high level of satisfaction with people’s own housing circumstances.
Obviously owners who have paid off their mortgages are satisfied, but it is revealing that most private renters are satisfied, and their satisfaction has fallen only a little since 2017.
Non-homeowners find affordability difficult – 79 percent are “very” or “somewhat” concerned about affordability of housing to buy, but that’s not much higher than the 71 percent who were concerned in 2017, when interest rates were lower.
One interpretation of those findings would be that the media has overstated the severity of the housing problem. Another, more compelling, interpretation is that the situation was bad in 2017 and is a little worse now. The finding on renters’ satisfaction is counterintuitive, but most respondents have ongoing rent arrangements, and not every property owner is a greedy opportunist. As in many markets, the problem is at the margin, among those trying to rent.
About 90 percent of us still think that owning a home is part of the Australian way of life, down only a little from 2017, but that view depends on respondents’ age: only half of people aged 18 to 24 see ownership as important.
There is a prevailing belief that homeowners like to see the market values of houses rise, a belief that makes government fearful of measures that would increase supply and reduce house prices. But evidence from the survey does not support that belief. In fact 41 percent of homeowners would be happy to see house prices fall, making housing more affordable, while only 27 percent of homeowners would be unhappy with a fall. (Others are undecided or indifferent.) When the same question was asked in 2017 homeowners were more resistant to the possibility of falling prices, but only a little.
John Howard once said that he had never met anyone who complained about their house going up in value. Those figures confirm that he was out of touch with at least 41 percent of Australians.
The Reserve Bank’s wonderful virtual world
In this pre-budget period almost every statement from a politician establishes their credentials in battling inflation, as if it is a severe and imminent threat to the Australian economy.
The simple reality is that we had a bout of inflation that peaked in early 2022 as we emerged from the pandemic, and it is on the way down.
That peak resulted from a combination of factors – unsustainably low interest rates from 2013 to 2022, the expansionary fiscal policy during the pandemic (the pent-up savings had nowhere to go until restrictions were lifted) – and a long period of low productivity resulting from successive Coalition governments’ having neglected economic reform. A fiscal or a monetary boost to a structurally weak economy is bound to result in inflation.
It’s safe to assert that the post-pandemic bout of inflation was what economists call “demand-pull” inflation – too much money chasing too few goods. That’s the sort of inflation monetary policy can help control.
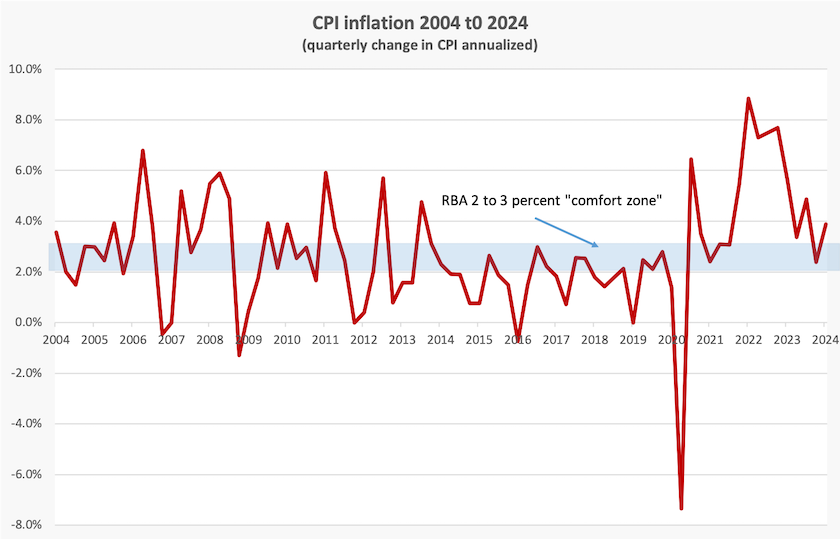
Tight monetary policy seems to have done its job. Inflation, as measured by the CPI, is falling as it has been since the RBA started raising rates in 2022. That fall is bumpy, but for many reasons the CPI has always been bumpy.
To go back to economic basics, economists’ concern is with accelerating inflation, which results when a positive feedback loop, with ever-increasing gain, develops between costs and prices, fed by loose monetary policy. That’s what happened in the Weimar Republic, Zimbabwe, and more recently in Turkey and Argentina. But if anyone looks at the graph of Australia’s CPI changes, it’s mathematically clear that inflation in Australia isn’t accelerating. (The second derivative of consumer prices is falling to put it in mathematical terms.)
We have a CPI that is still outside the RBA’s two-to three percent comfort zone, and it would be convenient to bring it back to that zone, but would the cost of doing that – in terms of the misery of unemployment and mortgage stress – justify the RBA pushing it too quickly?
It is possible that the remaining areas where prices are rising are untouched by monetary policy. Stephen Koukoulas, writing in Yahoo Finance, lists 8 items (lamb, fruit and vegetables, bread, tobacco, beer, gasoline, postal services, insurance), for which price changes are due to tax rates, weather, and international factors. Take these out of the basket, Koukoulas calculates, and the CPI over the last twelve months would have been 2.9 percent – within the RBA comfort zone of two to three percent, rather than 3.6 percent: RBA has gone too far and nervous nellies should admit it as interest rises don't impact these crushing costs.
In a dynamic economy prices do not move in lock-step, and when prices are moving unevenly there is a bias in the CPI to overstate the effects on the cost of living. If, for example, the price of electricity rises steeply while the price of energy-efficient appliances remains unchanged, consumers shift their consumption patterns. (Economists know this as the ”substitution effect”.)
We should query the use of that term “inflation” to describe every rise in the CPI (or whatever other indicator policymakers use). The term “inflation” usually refers to a general increase in prices, but some prices rise for sound economic reasons. Quite often price rises result from deliberate policies designed to improve resource allocation – withdrawal of unjustified subsidies, taxes or charges to account for the cost of negative environmental externalities, higher prices of food as a government cracks down on companies underpaying workers. These will show up in the CPI, but it is more accurate to call them price re-alignments rather than inflation. They tend to be once-off changes.
Yet the Reserve Bank’s statement on 7 May, following its meeting when it decided to keep the cash rate at 4.35 percent, reads as if it is hell-bent on tackling every rise in the CPI with the same zeal, regardless of its source. To quote:
In the near term, inflation is forecast to be higher because of the recent rise in domestic petrol prices, and higher than expected services price inflation, which is now forecast to decline more slowly over the rest of the year. Inflation is, however, expected to decline over 2025 and 2026.
Why should it matter that services inflation is higher than goods inflation? If, as is generally the case, the price of goods is set in overseas markets, and the price of services is set by local wages, isn’t that a manifestation of the benefits of trade, one of the key planks of mainstream economics? We buy clothes, toys and appliances from countries with lower wages, while keeping our wages high. That’s one of the points made by the ABC’s Ian Verrender, who points out that it has been an established pattern for the price of non-tradeable items (mainly services) to rise faster than the price of tradeables (mainly goods): Why further interest rate hikes by the Reserve Bank won't fix Australia's inflation problem.
And why should higher gasoline prices be of concern? If the RBA’s concern is with inflation resulting from strong demand – too much money chasing too few goods – then high gasoline prices have the same effect as the government taking money out of the economy using fiscal policy. What we spend at the pump goes largely overseas, once excise has been paid. Of course it may show up in the CPI, but surely the people on the RBA Board aren’t just chasing an indicator. Or are they?
Another quote:
Real incomes have now stabilised and are expected to grow later in the year, supporting growth in consumption. But there is a risk that household consumption picks up more slowly than expected, resulting in continued subdued output growth and a noticeable deterioration in the labour market.
More broadly, there are uncertainties regarding the lags in the effect of monetary policy and how firms’ pricing decisions and wages will respond to the slower growth in the economy at a time of excess demand, and while the labour market remains tight.
What do these two paragraphs mean? It is reassuring that the board acknowledges there are lags in the effects of monetary policy. But how do they suddenly start referring to “excess demand” in the second paragraph, which directly contradicts the first?
And another:
Conditions in the labour market have eased over the past year, but remain tighter than is consistent with sustained full employment and inflation at target.
This reads like a soft way of saying “unemployment isn’t high enough”. “Workers still have too much power in the labour market. We would like them to be quiet, anxious and compliant”.
That’s dismal economic theory. The dynamics of labour markets are such that, apart from collective bargaining agreements, workers generally gain higher pay by switching to higher-paid jobs with different employers. That’s one of the dynamics of capitalism. It’s how resources – labor resources – get assigned to their most productive uses. Does the RBA board really want workers to be locked into low-pay-low-productivity employment?
The quotes above are from the RBA’s short statement following its decision. At the same time it issued its statement on monetary policy, a regular document covering a wide range of economic and financial conditions that have a bearing on the RBA’s decision. There, in Sections 2.3 to 2.5, we get some idea of the numbers behind the bank’s phobia: wages are rising too quickly and unemployment is too low. They state that “Unit labour cost growth remains elevated, but it has moderated recently and is expected to slow further”, but they want to push it faster.
This is not to say the RBA board or its staff are stupid or callous. The RBA employs some of Australia’s cleverest economists. But as happens in so many disciplines, they seem to have built an elaborate intellectual framework based on fundamental assumptions and axioms that don’t align with the physical world as it has developed. Its dogged obsession has nothing to do with partisan economics or hostility to the Labor government. (It is doubtful that many economists, in their personal opinions, would want to see Australia subject to the corruption and incompetence of the Coalition governments we have had over the last few years.) Rather it’s about the investment they have made in that framework, and a defensiveness that develops whenever a discipline is found to be weak in its foundations.
Peter Martin, writing in The Conversation, sums up the RBA’s thinking: If the RBA’s right, interest rates may not fall for another year. Here’s why – and what it means for next week’s budget. The RBA is determined to go after what it sees as an increase in inflation. That is the CPI remaining above 3.0 percent. Martin, like other economists, points out that there is plenty of evidence that demand has slumped. Monetary policy has done its job on the demand side and the government, spooked by the RBA’s frightening hints of further increases in interest rates, might pursue a fiscal policy that pushes us into a recession.
All for the sake of some figure generated by the ABS.
Pre-budget musings
From a macroeconomic perspective, Ken Henry expects that the budget will “hold steady”. It won’t be fiscally expansionary – the sort of budget any government, particularly a Labor government, would like to present a year before an election. That’s because the government is desperate to give the RBA the fiscal space to give one or more interest rate cuts. But neither will it be a tight one: any fiscal surplus is likely to be a token one, as it was last year.
Henry is generally supportive of this approach, but he would like to see significant tax reform – unlikely in light of the Treasurer’s pre-budget media interviews.
On the public’s expectations the latest Essential poll has two questions about how people believe the budget will affect them. The poll was published last Tuesday, only one day after the government announced support for students and graduates, which means those surveyed would have been unaware of these intentions. But they would have heard about the tax cuts.
The first question is about the impact of the budget on the cost of living.
Only a minority – 30 percent – believe the budget will make a “meaningful difference”. Younger people are more optimistic on this question than older people.
The second question asks respondents who they think will benefit from the budget – people who are well off, people on lower incomes, average working people, you personally, and some other categories.
The well-off are expected to win easily, while individuals are expected to get only minor benefits. In fact about 40 percent of people believe the budget will actually be bad for people on lower incomes. In response to this question, which has been asked in successive years, people have expected the well-off to come out on top in previous budgets, but that expectation has not been so strong since Labor came to office. This is consistent with opinion polls that find people believe that the Coalition governs for the benefit of the rich.
For those who will be following the budget closely, Peter Martin has a Conversation contribution: Beyond the spin, beyond the handouts, here’s how to get a handle on what’s really happening on budget night.
There will be the budget speech, a carefully-crafted half-hour of spin, and there will be a glossy, telling you “exactly what the government wants you to hear, exactly as it wants you to hear it”.
Martin directs readers to a short statement that will appear in Budget Paper 1, Budget Strategy and Outlook. The statement to which Martin refers is called “The government’s economic and fiscal strategy”. Budget Paper1 is generally light on political spin (although it is not entirely free of it) and it’s the best source of data on spending and revenue.
As I did last year, I will include in the roundup some analysis of the broad figures, leaving the details to lobbyists and journalists.