Incomes and labour costs
Why do journalists talk about a “cost of living crisis” when the real problem is low wages?
We have a low-wage problem, and a housing problem. Both stem from poor policies long before this government was elected.
Why do journalists keep talking about a “cost of living crisis”? Is it laziness? Or is it partisanship, playing into the Coalition’s line that financial problems faced by households are all the fault of this economically incompetent Labor government?
Journalists love the word “crisis”, but they overuse it, because it refers to a distinct event, not an ongoing problem. The Macquarie Dictionary defines a crisis as “a decisive or vitally important stage in the course of anything, a turning point; a critical time or occasion”.
We had a crisis – the Covid-19 pandemic, from which we are still recovering – a recovery delayed globally by wars and related supply-chain disruptions. But that’s not the only reason many people are finding it hard to make ends meet.
More significantly we also have two related and longer-term problems, that go back to around the time of the 2008 global financial crisis.
One is a dramatic slowing in real wage growth in the post GFC period, followed by a collapse of real wages in the wake of the pandemic. Over 2023 wages started to recover from their pandemic low point, but they are only now back to where they were in 2011.
This history of real wage movements in the current century so far is shown in the graph below.[1]
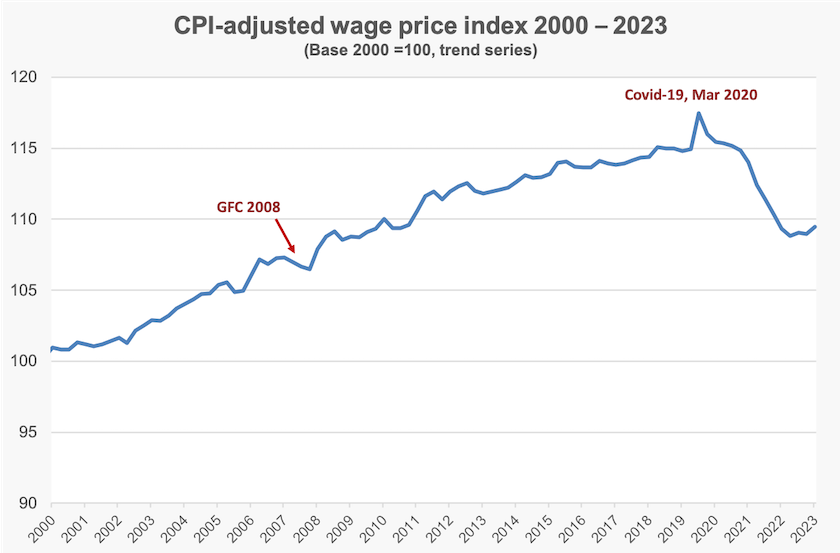
To respond to the Coalition’s lies one could make the catty observation that from 2013, when it was elected, until the outbreak of the pandemic, real wages rose at a miserable rate of 0.33 percent a year. After all it was explicit Coalition policy to suppress wages, and this was one of the few areas of economic policy where they succeeded in carrying out their policies.
But it is more informative to consider the broader structural problems that have brought us to our present situation, and that leads to the second problem, to do with housing – high interest rates affecting the roughly one third of Australians who have significant mortgage debt, and unaffordability of housing because of house price inflation.
Again, we can blame the Coalition for its irresponsibility in re-shaping the tax system in 1999 to encourage housing speculation, and its deceitful scare campaign about capital gains tax and “negative gearing”, but these are comparatively minor peccadillos against a backdrop pf fiscal irresponsibility by the world’s monetary authorities.
Here’s where our Reserve Bank made its worst series of mistakes – although it was following a pattern set by other monetary authorities worldwide.
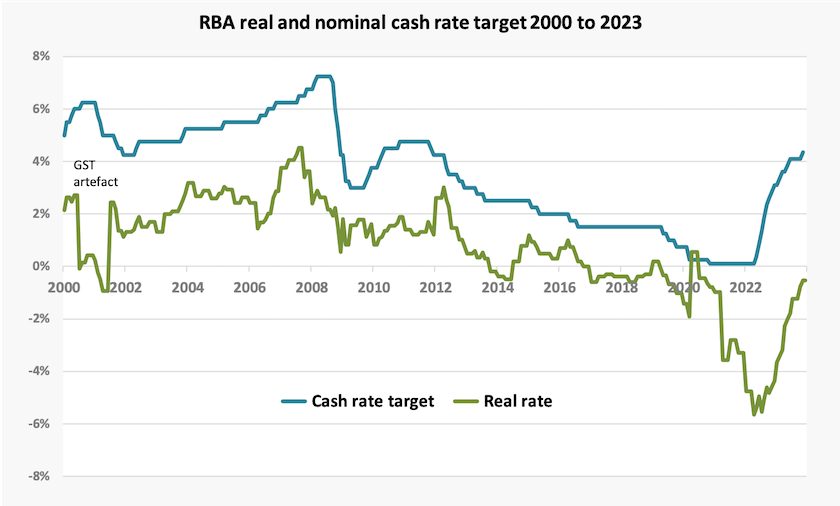
In response to the 2008 GFC the RBA dropped rates sharply, and then lifted rates in what it judged to be the recovery phase. But the economy didn’t recover, and from around 2002 right up to 2020, the RBA kept lowering rates, pushing real rates into negative territory, before starting a sharp reversal in 2022 – just before the election.
Borrowers are rightly distressed by the rapidity of the recent rise in interest rates, but the problem goes back to the period after 2012, when historically low rates set the world and Australia awash with money, resulting in overborrowing and housing price inflation – aggravated by a silly promise by the RBA not to raise interest rates before 2025. This recent history of monetary policy is shown in the graph below.
That prolonged monetary stimulus failed to re-invigorate the economy, because our economy is structurally weak, as a result of a long period, mainly on the Coalition’s watch, of neglect of economic reform, manifest in low and declining labour productivity.
But it did stimulate inflation, with a delayed effect, in the post-Covid period.
There is still too much money sloshing around the world, which is one reason the post-Covid recovery has seen an outbreak of extreme inequality in wealth and income. Just as the period of low interest rates had a delayed effect in stimulating inflation, so is a period of comparatively high interest rates having a delayed effect in soaking up that excess liquidity – an excess aggravated by policies during the worst of the pandemic which saw a huge fiscal stimulus. But that money had nowhere to go because the shops were closed. It went into short-term savings, which people have been spending down.
It is easy to sheet blame on to the political parties in government. In this regard the Coalition’s record is poor, because it held office in 20 of the 26 years between 1996 and 2022, over which time it almost entirely neglected structural reform. Its one reform – introducing the GST – was offset by its changes to tax and superannuation which have worsened intergenerational inequality. But there were bigger forces at play.
It would be easier to sheet blame on to the RBA, particularly their habitual impatience and over-reaction. But they have been following a pattern established in the world’s financial markets, and it would be folly for the central bank of a medium-sized country to pursue its own course, even if it makes sound economic sense. That’s why the sound principles of what is known as “modern monetary theory” (a ghastly name because its basic principles are not new) have difficulty in getting traction.
It would be helpful for all who are working towards structural reform if the media, including the unaligned media such as the ABC, stopped talking about a “cost of living crisis” and gave a more objective assessment of the state of the economy.
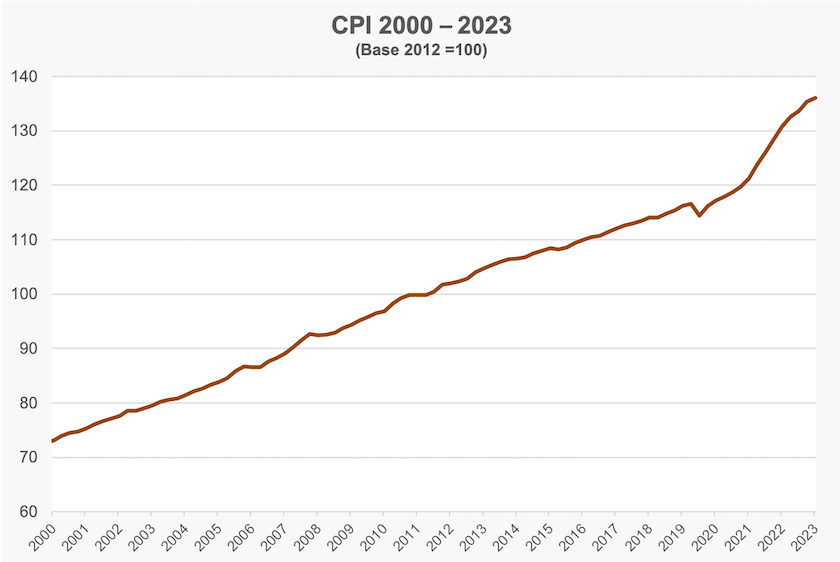
1. All data used to generate these graphs is from the ABS Wage Price Index (next release May 15), the ABS CPI, and the RBA Cash rate target series. It could be argued that in a time of reducing unemployment the wage price index is suppressed by the entry of new entrants to employment, at a lower rate of pay than the existing workforce, but this effect is likely to be small. ↩
How economists understand the labour market: it’s a grossly oversimplified view
Assessing full employment in Australia is the title of a Reserve Bank Bulletin contribution by Alexander Ballantyne, Avish Sharma and Tim Taylor.
It covers all the data sources we use to judge the performance of the labour market. These include the usual ABS labour force series, as well as less publicised leading indicators of employment and unemployment. They provide informative graphs of time series of these indicators. And they have generated a scatter diagram of observations of the relationship between labour underutilization and CPI inflation. A freehand line drawn through the dots might reveal something that looks like a Phillips curve, implying that there is a causal relationship between inflation and unemployment.
The authors’ bravest venture is some nifty numerical analysis generating a plot of how the non-accelerating inflation rate of labour underutilisation – that fabulous beast called the NAIRU – has been moving for the last 40 years. Their analysis suggests that over this century so far, the NAIRU has fallen somewhat, which means, according to the logic of the beast, we can enjoy a slightly lower unemployment rate without experiencing inflation than we did in times past.
But when one looks at their chart it suggests that the NAIRU is now around six percent, plus or minus one percent. That’s quite scary.
Will this figure influence the Reserve Bank Board in the lead-up to their next meeting on May 6-7, or will they be more influenced by the fact that we have 3.9 percent unemployment, CPI inflation of 0.9 percent over the last three months and tough trading conditions in many sectors? (Alan Kohler has a neat 2-minute videoclipexplaining that interest rate rises have had much more effect in Australian than they have in the US, because of the different nature of our mortgage market.)
An economics lecturer would undoubtedly give the paper’s authors full marks, because of the thorough way they cover the standard economics of the labour market. But to one who looks in from outside the profession, it is strange to see the implicit assumption that “labour” is some undifferentiated, fungible commodity, as if car mechanics, soldiers, nurses, lawyers, carpenters, teachers and so on all respond to the same market incentives and can slip into and out of one another’s jobs. Perhaps there was a relatively homogenous labour market some time in the past, but we have all become more specialized over time.
The authors acknowledge that “monetary policy has little direct effect on labour supply or structural features of the job market”, but apart from references to youth unemployment and to gender issues, there is little acknowledgement of the heterogeneity of labour markets. Is monetary policy reliant on a high-level abstract idea that ignores the complexity of the real world, as is implied in simple models such as the Phillips curve?
How supporting minimum wages reduces inequality
Bringing up the wages of the lowest-paid should reduce wage inequality. That’s fairly basic economic theory, and is confirmed empirically in a study by the European Trade Union Institute, summarised in Social Europe by Wouter Zwysen: Wage inequality in Europe – and why it is falling.
The article reveals that wage inequality among EU countries has been falling over the last 15 years, largely in response to a shortage of labour. That suggests the EU, in spite of different cultures and different stages of economic development, is working towards achieving its aim of economic integration. If free trade and easy movement of labour works to reduce inequality in a collection of 28 such diverse countries, it should be able to work on a wider scale, provided there are the institutions. as there are in the EU. to protect against destructive races-to-the-bottom.
The other finding, particularly relevant for Australia, relates to the mechanisms that were found to reduce inequality within EU countries. Unsurprisingly those countries that had a high rate of job vacancy experienced lowering inequality, but the most significant factor was the legislated rate of minimum pay. As a means of reducing inequality this was found to be more effective than trade union density and more effective than centralized collective pay agreements. Also unsurprisingly, decentralized firm-level agreements tended to be associated with widening wage inequality.
The study is important in terms of what it does not reveal. To quote from Zwysen’s conclusion:
Rising wage inequality is not, therefore, an inevitable consequence of new technologies or globalisation, to be fatalistically accepted. EU and national policies and labour relations still have a large impact on how wages, and their distribution, evolve.
The case for pay transparency
If you work in the public sector you probably know the pay and conditions of your colleagues. Pay transparency is one feature that sets the public sector apart from private companies (although even in the public sector the use of contractors detracts from this openness).
Writing in The Conversation Carol Kulik of the University of South Australia puts the general case for pay transparency: Why don’t Australians talk about their salaries? Pay transparency and fairness go hand-in-hand.
One effect of pay transparency is that it helps establish norms around what constitutes a fair pay. Once such norms are established there is less wage discrimination based on people’s ability to bargain for their own interests, rather than on people’s ability or productivity. There is solid and replicated research showing that women tend to feel inhibited when negotiating for their own interests (which doesn’t mean they are poor negotiators, because women tend to be tough negotiators when bargaining for their children or aged parents.) Also people from other cultures may find it particularly difficult to judge what constitutes a fair pay deal.
Pay transparency is not only about improving outcomes for the underpaid. As Kulik points out, there are many people who are paid above the going rate to believe they are underpaid.
The case for pay transparency is hardly a radical one. It’s a basic condition for the operation of economists’ much-worshipped competitive market that there be clear information of prices available to all players. That’s about as orthodox and conservative as you can get.