Other economics
October CPI data: Australia now has a deflation problem
The October Monthly Consumer Price Indicator reveals not only that inflation is licked, but also that we are now in deflationary territory. From September to October the CPI Index fell from 121.4 to 121.0, indicating an annualized CPI fall of 3.6 percent. Mission overaccomplished!
OK – it’s rough mathematics to annualize the difference between two figures, both of which have a significant margin of error, but there are two points to such an exercise.
First, the Monthly Consumer Price Indicator is calculated with less cover and precision than the quarterly CPI. For example the ABC’s headline Inflation dips more than economists expect in October implies too much precision, and in any event the CPI is a measure of household prices, not inflation. (An example of the sub-editor’s headline over-simplifying what is actually a well-crafted article by Michael Janda and Gareth Hutchens.)
Second, the media focuses on the year-on-year figure – the indicator in October 2023 compared with the indicator in October 2022, which reveals a rise in the CPI Indicator of 4.9 percent. It’s about what CPI inflation came to over the year to October, not what it is now, and it says even less about what inflation might be in the future, which should be the Reserve Bank’s main concern. That would be a nitpicking point if the curve were more or less flat, but it is a serious consideration when the curve, once some noise is ironed out, is falling.
If we take just the three months to October as an indicator of price movements, we find that the indicator has risen from 120.0 to 121.0, which annualized comes to 3.4 percent. The RBA Board can take an early Christmas break and read a few articles on delayed responses in systems. That’s still a fairly rough figure, but at least it is not influenced by what was happening between October last year and July this year.
The good news for households in the October ABS Indicator is that there have been hardly any month-to-month price rises in food and beverages, and that gasoline prices have fallen a little. Again, month-to-month price changes are subject to a fair bit of sampling error, but there is a certain consistency in stuff that really counts for most households.
Another important item is electricity: a graph of the ABS indicator, including its annotations, is reproduced below.
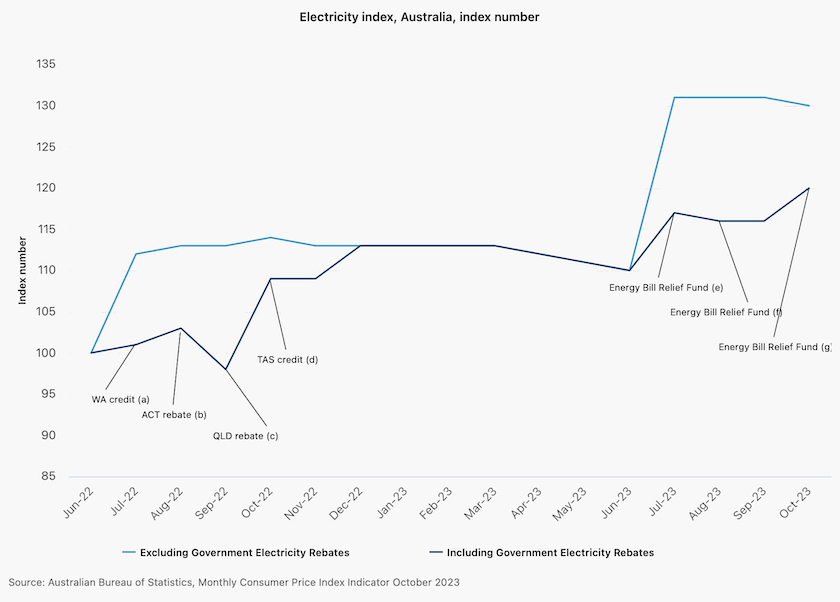
Electricity prices have risen over the last few months, and in view of the comparative ease in collecting electricity price data, the graph is probably a reasonable representation. Note that there’s a big but closing gap between the black and blue lines: the price before government rebates is falling while the price after rebates is rising.
The opposition and partisan media are forever accusing the government (the “Labor” government) of breaking promises about prices, as if they started the war in Ukraine and helped strengthen the global oil cartel, but there is a story in these figures about the relief the government has brought to households. But because most households are still receiving bills covering the colder months and they interpret a higher bill as a price rise, and because most electricity tariffs are set only annually, it will be a few months before complaints about electricity prices abate.
There isn’t anything in these figures to justify a rise in interest rates. But to repeat the point, the CPI is only one indicator of inflation. But if the RBA is really determined to push up unemployment it can surely find some other indicators to justify a rise in interest rates.
If the RBA does raise interest rates on Tuesday the government is likely to be rather annoyed. We might believe that the government would be tempted to use its powers to veto the Bank’s decision – a provision that hasn’t been tested for 93 years. But in fact Treasurer Chalmers has hinted that the government is thinking of removing that power from itself. At first sight that seems strange, but just as the government wishes to stress its separation from the High Court in the case of indefinite detention, so too does it want to be seen to be separate from the RBA. Writing in The Conversation – Governments have been able to overrule the Reserve Bank for 80 years. Why stop now? – Peter Martin argues against that idea of removing that power. The separation of powers between parliament, executive government and the judiciary, the issue relating to the Commonwealth’s powers to hold people in detention, dates back to the 18th century. But the RBA is a creature of government which must take ultimate responsibility for the RBA’s decisions, if they are consistent with the government’s directions, including the two-to-three percent inflation target.
Discretionary spending: why waste money on insurance bureaucrats?
When people are feeling the pinch they generally cut back on discretionary spending. In recent months the Reserve Bank has revealed that people, particularly young people, have cut back not only on discretionary spending but also on non-discretionary spending.
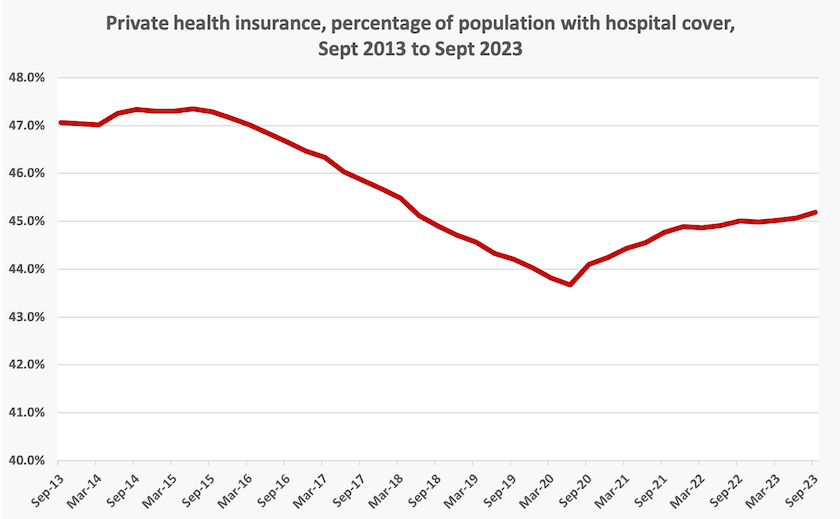
One area where discretionary spending has risen, however, is on private health insurance. From 2015 until 2020 there were promising signs that when they reviewed their spending people were realizing that private health insurance, in spite of all the subsidies and incentives provided by the government, is a bad deal. But then as the pandemic took hold people started to take up private health insurance again. The latest data, from the Australian Prudential Regulation Authority, confirms that Australians are still taking up private health insurance. The percentage of Australians with hospital cover has risen from its low point of 43.7 percent in June 2020 to 45.2 percent in September this year. That’s an extra 840 000 people who could be paying off their mortgages, or saving to fund their own hospital care rather than contributing to the profits and bloated administrations of private health insurers.
For some people over about 60, private health insurance may be a value proposition. But for younger people it is almost always a poor deal, because the entire incentive system relies on younger people, who are generally fit and healthy, subsidizing older people who are relatively heavy users of health care.
The same APRA data reveals that in the last three years about 270 000 younger people, many of whom would be struggling financially, have taken up private health insurance.
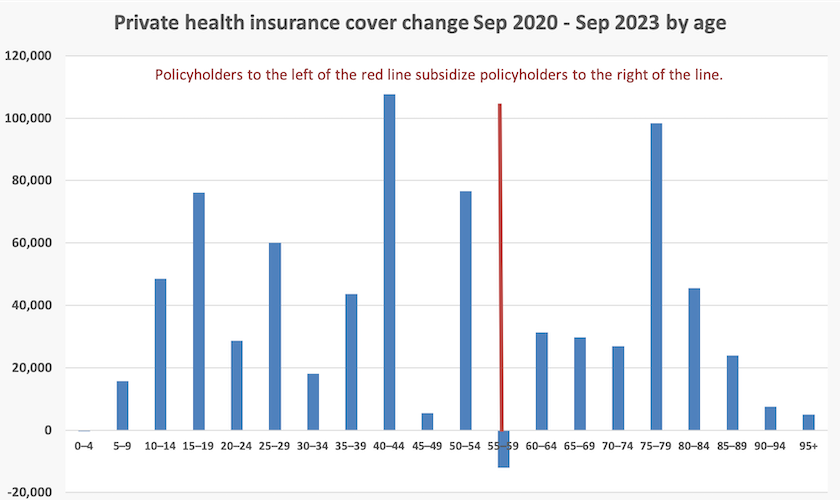
Therein lies an opportunity for the government to help younger people improve their economic lot. With a boost to state grants for hospitals, funded partly through withdrawing subsidies to private insurance, and some strong messaging, it could reassure younger people that they don’t need private health insurance. Older people may have to pay a little more for private health insurance, but that would help redress intergenerational inequities.
Such a policy initiative would be in line with basic Labor values: there was a time when Labor governments spent huge amounts of political capital, attempting to rid Australia of the scourge of private health insurance. The private insurers would squeal, but there would be no economic loss if they disappeared from the scene because they are only commission agents contributing little to health care. And private hospitals would have to compete with public hospitals for funding from state governments: a little competition would do consumers no harm.
Economic performance explained
A glance at data on comparative economic growth in “developed” countries confirms the impression that Greece and Italy are basket cases, that Japan, France and Germany are running out of steam, that the UK lost its steam in 1942, and that the US and China are the world’s remaining growth engines. Even when we normalize for different population growth rates, the picture is less stark, but the rankings are much the same.
That’s the common narrative, but it overstates the degree to which countries diverge from one another in their economic fortunes.
Joe Walker, whose website I recommend for a cornucopia of readings and podcasts to keep you going over the longest of Christmas breaks, brings to our attention an article by Jesus Fernandez-Villaverde, Gustavo Ventura, and Wen Yao of the University of Pennsylvania, The wealth of working nations.
In their analysis of 30 years of economic growth in 8 countries (the G7 plus Spain), they find that the neoclassical growth model (a model that considers an economy in terms of labour, capital and technology) explains away many differences in economic performance when population per working-age adult is considered. Most figures of GDP per-capita disregard the population age structure, and others such as GDP per adult disregard the adult age structure. In definitions of a nation’s potential workforce it has been a common assumption that anyone over a certain age such as 15 or 18 is available for work.
The idea that people were in the workforce until death was a reasonable assumption until people, with no consideration for statistical purity, decided to go on living a long time, and doing stuff like driving a Winnebago around Australia, helping charities, or writing political blogs. To account for this change in lifestyle the authors define the “working age” population as those between 15 and 64. When they do that most of the differences are explained by the neoclassical model.
Economic literacy
A quiz question:
As far as you know, all else being equal, a decrease in interest rates provides an incentive for people to:
- a) save more and borrow more?
- b) save less and borrow less?
- c) save more and borrow less?
- d) save less and borrow more?
That’s one of 6 questions put to Australians in a research project by Madeleine McCowage of the Reserve Bank, and reported in the RBA Bulletin: Economic literacy in Australia: a first look.
If you chose (d) you’re one of the 40 percent of Australians who understand this basic theory of monetary policy. You’re likely to be older, university-educated, better-off, and more engaged with economic news than the other 60 percent.
On two other questions to do with macroeconomic conditions and inflation, respondents generally performed better: 80 percent of respondents knew that unemployment rises in an recession, and they knew that if wages rise by 5 percent while prices rise by 7 percent, they’re a little worse off. But on other questions to do with monetary policy people’s scores were lower.
Out of several factors that correlate with economic literacy, having a university degree showed the strongest coefficient of correlation – much stronger than having studied economics or finance.
This research gives some insight into why, in successive elections, people’s education achievement correlates negatively with their support for the Coalition. It lends support to the proposition that the lower our education achievement the more likely we are to believe the Coalition’s lies, spin and falsehoods about their economic competence.
It would be informative if the RBA could ask Australians who they believe is responsible for interest rate rises – the government or the Reserve Bank. It wouldn’t be surprising if such a survey found that not many people understand that changes in interest rates are made by the Reserve Bank, and not by the government.