Other economics
The RBA statement on monetary policy. Grade: resubmit before Tuesday December 5
The RBA Statement on Monetary Policy, is a detailed explanation for its ådecision, routinely produced on the Friday after its Tuesday decisions.
If this latest statement were a student essay it would probably be returned with comments such as “substantiate”, “evidence?”, “having trouble following your reasoning”, “spell out your assumptions”, and if the lecturer felt redemption was possible a suggestion to “resubmit”.
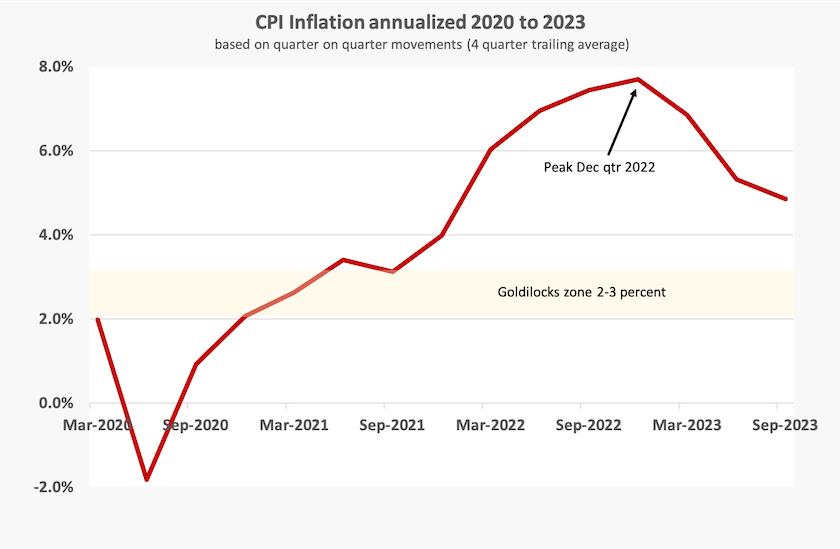
It is hard to see how its decision to raise interest rates, yet again, is justified. Inflation, as indicated by the CPI, is clearly on the way down, and while there is some evidence that it will come down more slowly than the RBA earlier estimated, there is also evidence that it will come down more rapidly. Inflation peaked in the December quarter last year and has been falling in the subsequent three quarters. The fall in the September quarter was not as sharp as in the previous two quarters, mainly because of gasoline prices and insurance prices, which have little connection to self-sustaining inflation. (In fact higher gasoline prices actually help reduce the money supply because gasoline is imported and demand is fairly price-inelastic.)
So why the haste?
We might expect in such a statement that the RBA could have explained what’s so terrible about inflation – so terrible that they felt it was necessary to keep on using its big blunt lever that imposes so much collateral damage.
But there is no such explanation in the RBA statement, which seems to justify its interest rate decision on too many untested assumptions and a possible means-end confusion. I have attached the statement, marked up in Word format, in a way a lecturer may return an essay assignment to a talented but confused student.
In a Saturday Paper article on the cost of living, Mike Seccombe points out that monetary policy isn’t working. There are many drivers of inflation, but monetary policy addresses only one of them, the money supply, or to put it in plain language, people’s ability to spend. But the impact is on those who already are finding it hard to make ends meet. It makes no economic sense to reduce people’s cost of living by a small amount if their capacity to spend is reduced by a greater amount, but that is the way monetary policy works. (Has the Reserve Bank made a catastrophic confusion of means and ends?)
Crispin Hull on his website refers to a paper Monetary policy, inflation, and crises: evidence from history and administrative data by four European economists, who conclude that monetary policy as it is presently applied just doesn’t work. Monetary policy is meant to stabilize economic activity, but the way it has operated, including in Australia, has contributed to economic instability. A long period of low interest rates contributed to excess money supply and asset-price inflation. As rates have been rising the vulnerabilities resulting from this period of easy money have been exposed, leading to economic crises.
Hull has a number of creative suggestions, centered on making monetary policy more flexible – why should the Reserve Bank be equipped with only one big, blunt instrument?
That four percent wage rise – no reason to get excited
The ABS Wage price Index for the 12 months to September prompted some sensationalized headlines, such as Wages growth fastest on record as aged care, award boosts lift pay rates on the ABC website.
A more accurate headline would have been “Real wages still falling”.
The ABC article by Michael Janda and Daniel Ziffer, linked above, gives a reasonably informative interpretation of the ABS data (although its main graph loses meaning because it lacks a legend). Over the year to September 2023 the price of labour – a measure that incudes costs such as superannuation payments but which moves closely with wages – rose in nominal terms by 4.0 percent. Over the same period the CPI rose by 5.4 percent, suggesting that real wages fell by around 1.3 to 1.4 percent.
The statement about a record rise is based on a nominal 1.3 percent rise over the quarter. If sustained that would result in a 5.3 percent nominal wage rise over 12 months. That would really encourage the RBA to lift rates.
But if we examine the data on the ABS website carefully we see that the rises have been most prominent in “accommodation and food services”, reflecting a rise in the minimum wage, and in “health care and social assistance”, reflecting a rise in pay for workers in aged care. These rises are manly about a catch-up in sectors where awards had been particularly low. Although there are still some enterprise bargaining agreements still to be settled, it is most likely that the December quarter will see a much lower wage rise.
As ACTU Secretary Sally McManus says, there is no reason to expect a wage-price spiral. It’s an important message for the Reserve Bank, because the basic task of monetary policy is to prevent the positive feedback process of accelerating inflation. The Bank should have no business in reacting to price adjustments associated with rectifying wage injustices or entrenched underpayment.
As for that word “record”, it is a record only because the index does not have a long history: a 4 percent wage rise in the 1970s would been considered a low figure. This may seem to be a nitpicking point, but headlines count, and the headline chosen by the ABC sub-editors is prone to convey the impression that there is a wage breakout, adding to inflationary expectations. Editors and sub-editors need to be more cautious – and not muck up graphs by deleting the legend.
Who is and who isn’t paying taxes
Drawing on the Australian Tax Office’s 2021-22 Corporate tax transparency report, the ABC’s Nassim Khadem reveals that more than 800 large companies paid no tax in 2021-22. These include Insurance Australia Group, Exxon Mobil Australia, AGL Energy, Qantas, Shell Energy Holdings Australia, and Singapore Telecom Australia Investments (the holding company for Optus).
Khadem reports on the reasons some of these companies paid no income tax. It’s generally because they made no profit in 2021-22. Also some companies that paid little or no income tax may have been among the 11 entities that paid $2 billion in petroleum rent tax.
Another way of considering the ATO report is to look at who did pay tax in 2021-22. With no more than a simple sort, and some percentage calculations. I have copied the ATO Excel spreadsheet, adding three columns (in red) to demonstrate who are the biggest taxpayers.
Of the $84 billion in company tax collected in 2021-22:
- 28.5 percent was from three mining giants – BHP, Rio Tinto and Fortescue;
- 10.0 percent was from the big four banks (Commonwealth, Westpac, NAB and ANZ) who were next in line as the biggest taxpayers;
- 50.0 percent was from just 16 companies, including the 7 companies just mentioned.
These figures suggest that our corporate taxes are highly dependent on a handful of very profitable companies, including three that are highly dependent on commodity prices.
One feature that stands out is the prominence of three retailers – Wesfarmers (#14), Woolworths (#23) and Coles (#27) in the list of big taxpayers and therefore highly profitable firms. And how come a firm describing itself as providing consulting services to the education sector is in position #13? Is this not a public service that should be provided most effectively and at lowest cost by a government agency, such as the Commonwealth Department of Education?
Others may like to dig a little further into my spreadsheet, or to download their own from the ATO site.
“Thank you for making me feel smart”
That’s a statement of gratitude from a student to a teacher, used in a Commonwealth-funded advertising campaign Be That Teacher, aimed at attracting young graduates to teaching and at retaining those who are in the profession.
On a recent Saturday Extra session Geraldine Doogue discussed the campaign with Fiona Longmuir of Monash University: Advertising campaign to recruit more teachers. Longmuir described the expectations we place on teachers, and the stresses they face, particularly the burden of non-teaching work associated with performance management systems. Longmuir explained that the campaign is aimed not only at teachers, but also at the public at large, so that they can pay teaching the respect it deserves.
Writing in The Conversation Virginia Beal of the University of South Australia reveals some disturbing numbersabout our shortage of teachers, including Commonwealth government modelling that predicts a shortfall of 4 000 teachers by the year after next.
Beal and Longmuir acknowledge that advertising alone won’t fill the gap. Teachers rightly complain about being overworked and underpaid.
Current problems in the school education system should be seen in the context of a succession of Coalition governments pursuing a war on learning. Their vision of the economy is one with many low-paid jobs that don’t need education past Year 12. Also, in terms of electoral politics, the Coalition has never been keen on an educated electorate, who react negatively to their patronising political campaigns.
The Coalition has certainly been effective in turning around Australia’s trend to higher education achievement, as shown in the two graphs below, taken from the ABS Schools data series.[1]
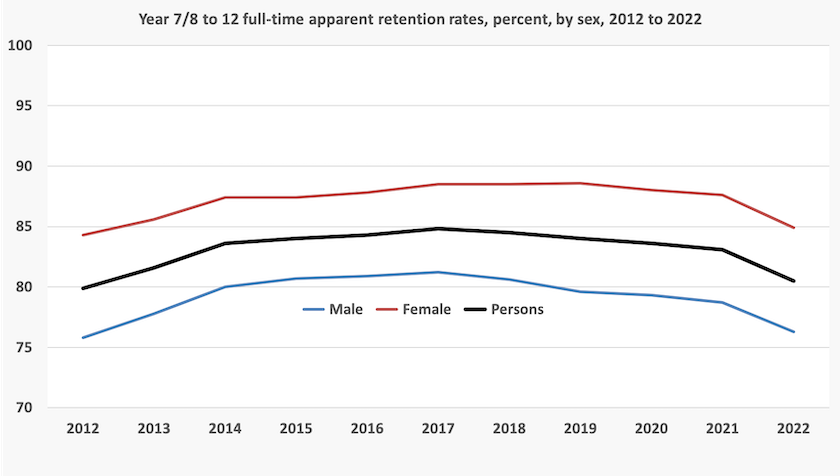
Those curves should be heading up to the 100 percent line, rather than bending over. Note particularly the male-female gender difference.
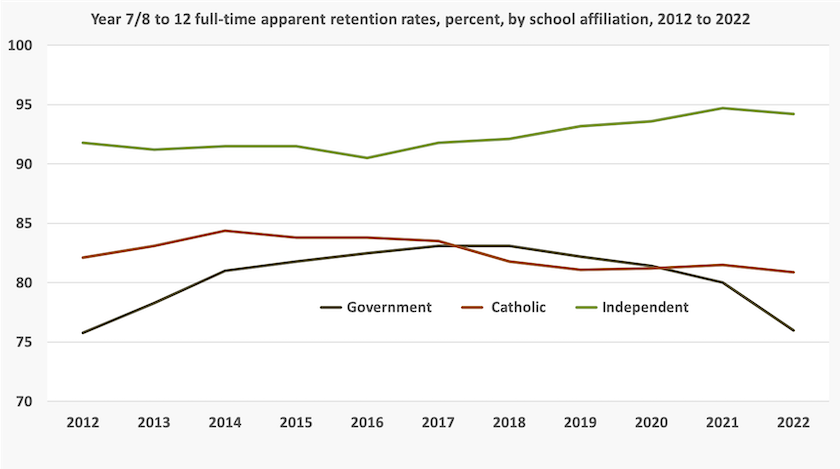
This dismal outcome is manifest mainly in the government school sector. The Coalition achieved its objective mainly through starving government schools.
What employment will there be for the one in four young men who fail to complete Year 12, let alone those who don’t go on to post-school education? What is the cost of this waste of economic potential? Also, in view of established mating preferences, there are going to be many men left out of meaningful work and without partners. What are the implications for demands on the criminal justice and social support systems, and do we want to live in such a society?
The Coalition, with its war on education, its aversion to well-paid jobs, and its obsession with “small government”, has left the present and subsequent governments with a massive structural problem to solve.
1. These are called apparent retention rates, because they are based on assumptions that those who progress from Year 7 to Year 12 do so in 6 years, and that those who start Year 7 in a Catholic, government or independent school and make it to Year 12 do so in the same school system. The potential errors resulting from these assumptions are small . ↩