Other economics
The much-awaited CPI
On Wednesday the ABS released the CPI for the September quarter. Over the quarter the CPI rose by 1.2 percent: that would come to 4.9 percent if sustained over a year. Over the year to September 2023 the CPI rose by 5.4 percent.
These figures have allowed the ABS to run the headline “Annual CPI inflation eases again in the September quarter”, which should calm the financial markets and ease the anxiety of mortgage holders, fearful of another interest rate rise. As usual the ABS notes the areas where prices have risen most strongly – electricity, gasoline, rents, insurance. Notably annual food inflation has eased: in fact fruit and vegetables are now 6.4 percent less expensive than they were a year ago. (Remember the floods of 2022).
There is little in this CPI data to suggest that prices are being driven by excess consumer demand or by a cycle of wage rises. As the ABC’s Ian Verrender points out, higher fuel prices, although they show up in the CPI, actually have the same macroeconomic effect as a rate hike. That’s because what we pay for gasoline or diesel is split between foreign oil companies and the government as excise. In both ways money is taken out of the Australian economy.
There doesn’t seem to be any reason for the Reserve Bank to raise interest rates on Tuesday week. That is, unless it is impatient to kill inflation faster, with little regard to the economic cost of doing so.
Mobilizing women
Just imagine – the income of each household could be boosted by $13 000 if there were a purposeful removal of the persistent and pervasive barriers to women’s full and active participation in economic activity.
That $13 000 comes from a back-of-the-envelope calculation applied to the headline figures in the report of the impressively-named Women’s Economic Equality Taskforce: A 10-year plan to unleash the full capacity and contribution of women to the Australian economy.
The report points to the persistence of gender pay gaps and of industry and occupational gender segregation in the workforce.
Most media attention has been focused on its proposal that over the long term government-funded parental leave should be extended from 26 weeks (the government’s present plan) to 52 weeks. It also calls for more investment in “universal, high-quality and affordable early childhood education and care” and for abolition of the Child Care Subsidy Activity Test.
For the most part, however, the report is about the systemic economic disadvantages faced by women and general impediments to women realizing their full economic potential.
It’s not as if Australian women are living the pattern of 1950s “housewives”. In comparison with other prosperous countries Australia has quite high female labour force participation, as is shown in the chart below, constructed from OECD data.
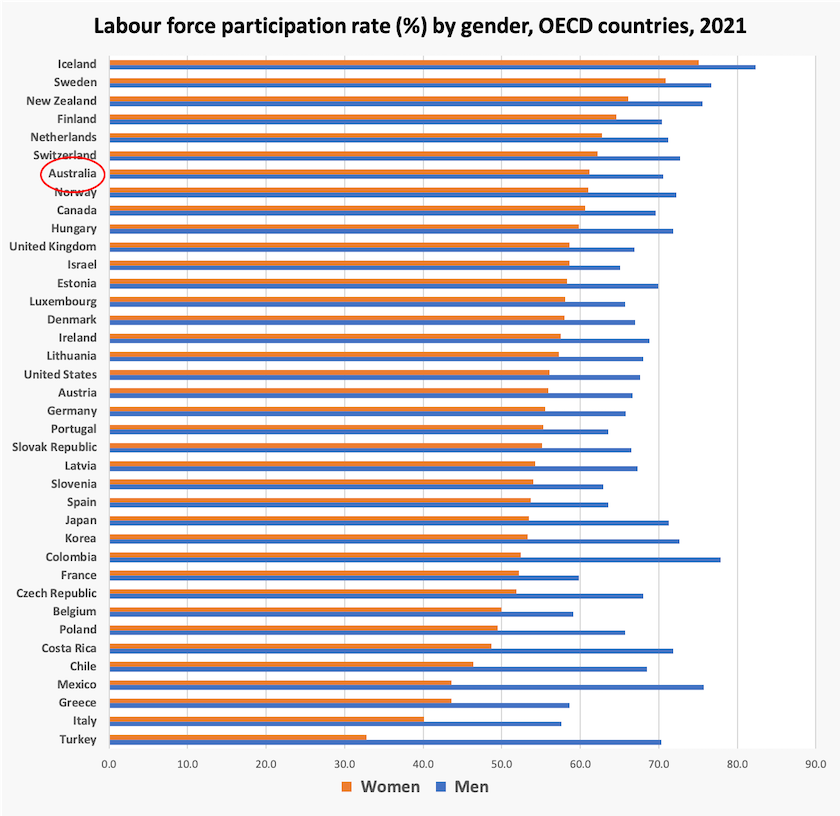
Notably quite a few high-income countries have lower labour force participation by men and women.
Perhaps the main point to be drawn from the report is that we may all be better off if there were more equality between men and women in paid and in unpaid work.
As for that estimate of $13 000 a household, based on the report’s headline claim that the economy would be $128 billion better off “by purposefully removing the persistent and pervasive barriers to women’s full and equal participation in economic activity”, it’s best taken with a grain of salt. It’s based on a document by Deloitte Access Economics Breaking the Norm: Unleashing Australia’s economic potential. It’s an informative document – for those interested in hard data on gender equality it’s richer than the taskforce report.
On a quick read, that $128 billion seems to be based on GDP measurement conventions, and it does not adjust for the possibility that with more gender equality more men will switch from paid to unpaid work, reducing measured GDP but not really reducing their economic contribution. Unfortunately it is many years since the ABS has produced estimates of the value of unpaid work in the Australian economy, data which would give us a fuller picture of the economic benefits of more gender equality.
Australia as a nation of savers
There is a long-standing model of Australia as a country that is heavily reliant on foreign capital, particularly equity capital.
In fact since around 2010 our equity position has changed. Australians now hold more equity in foreign countries than foreigners hold equity in Australia.
This is one of the revelations in a paper by the Reserve Bank The extraordinary decline in Australia’s net foreign liabilities. Our positive balance on equity is offset by a negative balance on debt – our net liabilities are around 30 percent of GDP. But as the authors point out, there has been a sharp decline in our net liability position just over the last ten years. To quote from the paper “national saving has been higher than national investment resulting in capital outflows and current account surpluses for the first time since the 1970s”.
Although it may not be evident at a household level, we have become a nation of savers. Superannuation has played a strong role in this development, as has a positive trade balance associated with high commodity prices.
The authors do not make a normative judgement on our declining net foreign liabilities: there is nothing good or bad about a positive or negative liability position. (It’s a pity that in public finance we have come to see debt as intrinsically bad.) They point out, however, that we are in a strong position because our external liabilities are mostly denominated in Australian dollars.
Jim Chalmers caught out
Treasurer Chalmers generally comes across as the very model of a modern treasurer, but the RMIT-ABC Fact Check unit has caught him fibbing about wages: Jim Chalmers says average full-time workers are $3 700 better off per year under Labor. Is that correct?.
The figure is indeed correct. That is, if one considers nominal wages and disregards the effect of inflation in eroding real wages. But in real inflation-adjusted terms, the average wage has fallen by about $2 000, as the factcheckers show.
It takes only a little early high school mathematics and a few minutes to look up the ABS website to convert nominal amounts to real inflation-adjusted amounts.
Why do politicians persist with this sort of statement? With or without doing a calculation it’s easy for people to see through such statements, and they lead to an impression that everything the treasurer says is spin. That’s an important consideration when a large part of a treasurer’s job is to instil confidence in the government’s economic management.