Economics
The Reserve Bank – right decision, unconvincing explanation
Few will be surprised to learn that the RBA has decided to leave the cash rate target unchanged at 4.1 percent. Its press release, however, keeps open the possibility of future rises, with the statement “Some further tightening of monetary policy may be required to ensure that inflation returns to target in a reasonable timeframe”. Also it comments that “the prices of many services are rising briskly”, implying that wage growth is still driving inflation, while neglecting to mention that service price inflation in Australia is driven mainly by factors other than labour costs.
It correctly states that “if high inflation were to become entrenched in people’s expectations, it would be very costly to reduce later, involving even higher interest rates and a larger rise in unemployment”. But it asserts categorically that inflation is “6 percent”.
That 6.0 percent is the rate of the CPI price rise over the year from July 2022 to June 2023, a historical figure. The latest estimate of annual CPI inflation, which can be calculated from the June quarter figures, is that it’s around 3.2 percent. That 3.2 percent is based on the 0.8 percent rise in the June quarter (or 3.6 percent going on the seasonally-adjusted rise of 0.9 percent).[1]
Quarterly CPI inflation peaked in the March quarter last year. It was still high in the September and December quarters. Those high figures will not be in the next two quarterly estimates. Assuming the RBA doesn’t change its ways, and keeps on using figures over the previous 12 months, then its annual inflation figures should fall rapidly. If CPI inflation for the next two quarters remains at 0.8 percent, as in the June quarter, the next two annual rates will come in at 5.0 percent over the year to September and 3.9 percent over the year to December. This hypothetical outcome is shown in red in the last two rows in the table below.
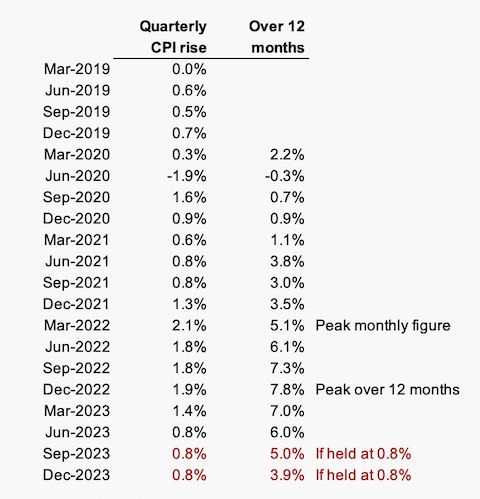
Or to be even bolder, if CPI inflation were to come in at 0.4 percent for the next two quarters, the 12-month figure would be 3.0 percent, just inside the Bank’s comfort range. In view of the rapid fall in quarterly CPI inflation over the last two quarters, such a trajectory is possible, but much will depend on the impact of higher electricity prices, and probable higher grain prices, which will show up in the September quarter. Neither of these rises will result from wage pressures.
This is the sort of discussion the RBA should be having with the public, getting across the message that CPI inflation is on the way down. In promulgating that high estimate of 6.0 percent, the RBA is virtually giving licence for firms, and those few workers who have bargaining power, to go for higher prices and wages.
Why is the RBA helping raise people’s inflationary expectations?
1. That is the compound growth of 0.8 percent over 4 quarters, which comes to 3.24 percent. (At low rates of inflation an arithmetic approximation of 0.8 X 4 gives a reasonable estimate.) ↩
What is full employment?
In 1945 the Curtin Government produced the White Paper on Full Employment, a document setting the economic principles for postwar reconstruction. The paper’s authors accepted that the closer the economy would come to zero unemployment the greater would be pressures on inflation and public budgets, but it did not qualify the adjective “full” by suggesting it was when unemployment was 2.0, 3.5, or 4.5 percent, to use some figures recently bandied around. The White Paper was written a good 13 years before economists adopted the quasi-mathematical idea that there is a firm relationship between unemployment and inflation, articulated in the Phillips Curve.
For the following twenty years Australia enjoyed high economic growth, moderate inflation and an unemployment rate around one to two percent. Zero unemployment was an aspiration, rather than a target. When the unemployment rate surged to around three percent in 1961 the Menzies government almost lost office, saved only by the Communist Party having directed preferences to the Liberals in a crucial seat.

They understood the meaning of “full employment”
In the pre-election period last year, Labor politicians were talking about producing another white paper on full employment. In office, however, the government has quietly dropped the adjective “full” from that commitment. Treasury is now drafting a White Paper on Employment.
Yet, as Peter Martin explains in his regular Conversation contribution, the government will try to define what “full” employment means in the current context: Australia is about to set its first full employment target – and it will define people’s lives for decades.
That definition counts, because it will probably guide the Reserve Bank in its monetary policy decisions. As Martin points out, the government sets an inflation target for the Bank, but it does not also set an unemployment target. A system with only one control (the interest rate) cannot pursue targeted outcomes of two variables at the same time. That’s the simple logic of systems, but the Bank will probably be partially guided by the number the government defines as “full employment”.
Martin speculates that the figure may be around 3.5 percent – a low figure by 2023 standards, but when we recall Menzies’ experience, saved from political death by his comrades, 3.5 percent is outrageously high by 1961 standards.
It’s a pity, however, that we allow public policy to be so influenced by pseudo-mathematics.(See the Public ideas section of this roundup.)
Neoliberalism died on September 15, 2008
That was when Lehman Brothers filed for bankruptcy, perhaps the most noteworthy event of the Global Financial Crisis.
In his Policy Post article – Neoliberalism is dead, killed by the GFC. A new, fairer era has begun – Martyn Goddard provides an economic history of Australia over the last 90 years, in terms of economic policy and economic performance, particularly developments in the distribution of income.
He divides that 90 years into three phases – the Keynesian era up to around 1975, the neoliberal era from 1975 to around 2012, and the “Post-GFC recalibration since then”, a period when many instruments of economic policy have been behaving in ways that don’t conform to the established equations of economic orthodoxy. The GFC seems to mark the time when neoliberalism started to reveal its contradictions and failures: 2008 was the peak of the GFC, and it was around 2012 that economists came to realize that the GFC had not been a normal business-cycle recession.
Since then policymakers in “advanced” economies, including Australia, seem to have muddled through, while slowly abandoning the fads of neoliberalism – privatization, trickle-down economics, austerity, and small government.
Goddard suggests that the economic system emerging from the ruins of neoliberalism is fairer in some dimensions, but so far it has not been of benefit to those with insecure employment, without easily marketable skills, and in occupations for which demand is weakening.
Come fly with me, if you can afford it and have plenty of time
There was a time, perhaps up to 30 years ago, when an opportunity for travel was an attractive feature of a job. Now, however, job applicants seek positions without too many travel demands.
In part that’s because air travel lost its novelty value a long time ago, and in larger part it’s because air travel has become so unpleasant.
On the ABC’s Saturday Extra last week Geraldine Doogue interviewed David Flynn, Editor-in-Chief at Executive Traveller, asking him Will more airline competition bring down airfares?
Flynn’s response was essentially in two parts – international and domestic.
Internationally, although the government speaks about the wonders of competition, it seems to be running a protectionist restraint on trade. He describes the glacially slow process of the bilateral negotiations when airlines seek an Air Services Agreement to operate between Australia and other countries. Don’t expect to see new international carriers any time soon.
Domestically the situation is even worse. He describes the practice of “airport slot hoarding”, whereby the established airlines obtain landing rights at busy airports, and don’t use them. He also explains that airlines in Australia are required to operate only 80 percent of their scheduled services. That’s why you might turn up at the airport with a ticket for an 11 am flight, which will get you to your destination in good time for your 2 pm job interview/presentation of tender documents/lecture at a university/medical appointment/connection with an international flight, and be told you have been re-booked on a 2 pm flight because there weren’t enough passengers booked on the 11 am flight to make it worthwhile for the airline.
By any criterion of what passes as acceptable behaviour towards consumers this is disgraceful. It imposes costs on consumers and businesses, who have to cope by allowing a large buffer of idle time and possibly overnight accommodation, or by choosing to drive rather than to fly, when it is important to be at a destination on time.
This is another reason why Australia needs a proper train service between its main capitals. If the economists who model a fast train service took into account the true cost of flying, and set that as a benchmark train fare – or even a premium over the airfare as in Europe – a proper intercapital train service would surely be financially viable.
Weird stuff is happening in the housing market
Higher interest rates have reduced buyers’ capacity to pay for houses. Therefore by the laws of supply and demand house prices should have fallen.
But they haven’t.
That’s one of the revelations in an article “Premature”' house price rebound raises risks of double-dip downturn despite RBA interest rate pause by the ABC’s Michael Janda and Stephanie Chalmers.
Is it possible that there is a lag between a fall in buyers’ capacity and a consequent fall in house prices? Are we yet to see the influence of distressed sellers – those who have been caught by 12 interest rate rises?
Michael Janda, in association with Rachel Pupazzoni, has been looking further into the housing market, to see if there is evidence of an increasing incidence of distressed sales: Jump in quick home resales blamed on rising mortgage stress by analysts, real estate agents.
The graph below, drawn from their data (originally supplied to the ABC by Core Logic), shows a marked uptick in the percentage of houses that have been re-sold within two and three years of their previous sale.
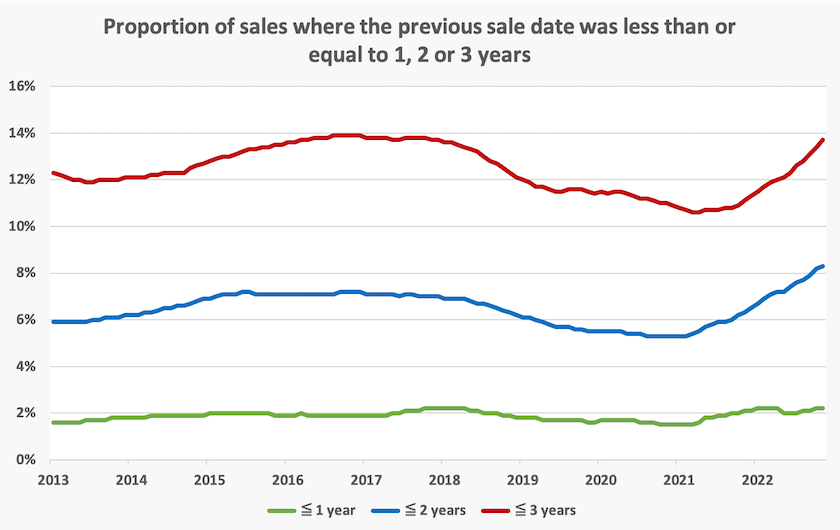
Is this uptick a manifestation of distressed selling by homeowners, or is it a manifestation of more turnover of properties traded by speculators?
Even if we ignore the changes in turnover, the baseline turnover seems to be high. As revealed in ABS mobility data Australians do not shift house very often. To the delight of real-estate agents, and state governments collecting stamp duty, so-called “investors” (in reality speculators responding to taxation incentives favouring short-term asset turnover) would be responsible for a large chunk of the movements revealed in this chart. If the recent surge results from speculators having to unload their properties, no-one will shed any tears for them. But if it is because of distressed selling by homeowners who bought recently, possibly influenced by the RBA’s message that interest rates would be on hold for some years, then it’s a tragedy.
Notably the initial surge in two and three-year sales occurred over 2012 to 2016, the same period that the RBA was lowering interest rates. The more recent and more-pronounced surge actually started a good year before the RBA commenced its aggressive series of interest rate rises in April last year.
It is also notable from Janda’s and Pupazzoni’s article that the latest surge has occurred mainly in markets other than the highly-priced Melbourne and Sydney markets. Instead it has occurred in smaller capitals, where house prices have been rising off a much smaller base. This is consistent with what one would observe if the recent fast turnover were driven by speculators who bought in capitals with comparatively low prices, in the hope of making a fast buck. So far there may not be much distressed selling by people having to move out of their homes. After all, banks give people grace periods, and it takes time to put a house on the market.
We are yet to see the full effect of the Reserve Bank’s actions over the last ten years. Media attention is focussed on the recent rise in interest rates, but the real damage was probably been done by the Bank’s pushing down interest rates over 2012 to 2014, driving massive inflation in housing values. It took no responsibility for that inflation because it was concerned only with the inflation captured by the CPI. Pubic policy has been driven by an arbitrary definition of “inflation” that ignores asset price inflation.
As for the future, booms lead to busts. The question is whether the housing bust will be fast or slow.
Geography matters
Our approach to economic geography suffers from lazy classification, in that the term “regional” has come to mean that 99.5 percent of our land lying outside our capital cities, as if there is some non-capital quality shared by Parkes, Pilbara and Port Augusta, and that our capital cities are homogenous blobs.
The CSIRO, in association with the Tech Council of Australia, paints a richer picture in its publication The geography of Australia’s digital industries, mapping clusters of digital industry activity. These clusters are mainly, but not exclusively, within the Sydney, Melbourne, Brisbane and Canberra conurbations. They are in distinct regions within those cities, generally in regions close to the city centres, but also including some distinct urban regions some distance from CBDs, such as North Ryde in Sydney and Glen Iris in Melbourne. Sometimes they are centred on a university, but generally the growth of clusters seems to be organic.And there is a fair scattering of clusters in other regions, such as Newcastle and Byron Bay.
The report mentions three policy approaches governments can use to help high-tech clusters develop – place-based, culture-led, and skills-led. Place-based policies involve traditional measures such as technology parks and location incentives. Culture-led policies focus on urban amenity, and skills-led policies relate to investments in education and training institutions, and measures to attract skilled migrants. Over many years we have probably over-invested in place-based policies (National Party boondoggles come to mind) in comparison with reliance on other policies.