Economics
University education – a Coalition success
During its time in office, from 2013 to 2022, the Coalition saw impressive progress in its war on learning.

Six years ago, 83 percent of students in public schools finished year 12. Last year it was down to 76 percent. By 2021 the number of students graduating with their first bachelor degree was the lowest since 2014, and the Commonwealth Department of Education forecasts that there will most probably be a further fall in graduations in the next few years.
That observation on public school Year 12 completion is from a Press Club speech on July 19 by Education Minister Jason Clare, and the observation on universities is one of many findings in the Interim Report of the Australian Universities Accord, released on the same day (Page 35).
The Albanese government commissioned the review on universities in response to a developing mismatch between Australia’s future workforce needs and the rate of graduation from universities. To state from the interim report’s introduction:
To successfully tackle our big national priorities – including lifting economic productivity, making a clean energy transition, building a caring society, meeting the defence and security challenges of our region, and strengthening our democratic culture – our higher education sector must become much, much stronger. Scientists, engineers, qualified carers and others will be needed in larger numbers. So will cutting-edge research that can be more easily absorbed by government and industry.
The report’s authors predict that “90 percent of jobs created over the next five years will require a post-secondary qualification, and 50 percent a higher qualification”. The report’s projection of jobs growth (Page 46) depicts an economy where employment growth is in non-routine services requiring the exercise of professionally-informed judgment.
The report’s recommended approach is “growth for skills through greater equity”. No doubt for a Labor government achieving greater equity is important, but a more equitable distribution of education opportunities is also a means to a macroeconomic end. There is a huge opportunity cost in leaving young Australians uneducated. One part of that cost manifests as a skills shortage, and the other part manifests as a set of social problems that arise when there is a large pool of unemployed and unemployable young people, particularly young men whose education attainment is falling further behind that of young women. (There is a nine percentage point difference in Year 12 completion rates between young women and young men.) One specific consequence is a concentration of poorly-educated voters in non-metropolitan regions, ripe for indoctrination from conspiracy theorists and the far-right media.
There is a strong regional emphasis in the report and in the government’s response, because the further one lives from our urban centres of learning, the greater is the educational disadvantage. For example while 97 percent of young people in Adelaide complete Year 12, only 54 percent of young people in non-metropolitan Tasmania complete Year 12.
The initiatives identified in the report are generally about making post-school learning more accessible throughout Australia, outside capital cities and in outer suburbs – a welcome acknowledgement that within our sprawling cities there are regions of disadvantage. (For too long the word “regional” seems to have been confined to regions contested by the National Party, ignoring regional disparities within big cities.)
Because of these disparities in Year 12 completion, which can be traced back to disparities right along the line, attention has to be paid to early childhood learning. (Clare mentions a two-year reading skills gap in 8-year-olds from poor and wealthy families.)
Clare explains in an ABC interview that the government is particularly enthusiastic about helping young indigenous Australians achieve post-school education. While about 50 percent of Australians have a university degree, for indigenous Australians that figure is only 7 percent. The government will ensure that tertiary education support for young indigenous Australians, presently available only to those in non-metropolitan regions, is made more available. (12 minutes)
Chair of the Universities Accord, Mary O’Kane, provides more detail about the report, explaining what Australia will look like when all young people achieve a post-high school education, from university, TAFE, and in some blended models. Because post-school education world-wide is changing, the report isn’t just about doing more of the same. She also describes some of the ways universities can be made more civilized places for students and staff. (9 minutes)

Writing in The Conversation Gwilym Croucher of the University of Melbourne explains how students can take advantage of learning in education that blends the offerings of TAFE and universities: Many Australians will need to study at both TAFE and uni: how do we get the two systems working together?. There are many problems to be overcome, including conservatism in both sectors, and the fact that while universities come under Commonwealth policy, TAFEs come under state funding. These problems can be overcome: the possibilities of integrated TAFE-university learning are described in Part 2.2.3 of the report.
And why the echidna? The answer is in the interim report on universities, which are rather prickly places.
Employment and unemployment
The labour market remains strong: in spite of the Reserve Bank’s efforts the unemployment rate has been hovering around 3.5 per cent for about the last eight months.
The long-term trend in unemployment is shown below. The general historical pattern has been for unemployment to fall steadily, until the labour market is clobbered by a recession, but since around 2011 the labour market has been less predictable.
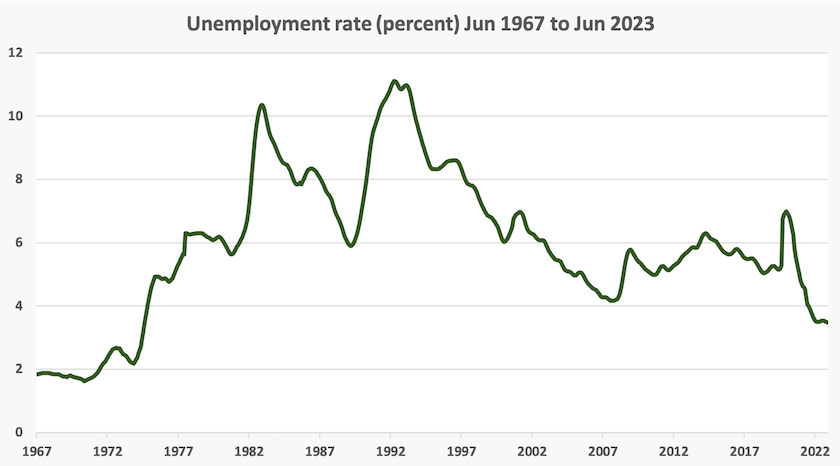
Writing in The Conversation, commenting on recent developments, Jeff Borland of the University of Melbourne notes that unemployment is staying low at 3.5 percent. But for those out of work, here’s why it’s become harder to get a job. Up to about a year ago net vacancies were being filled by the unemployed, but since then “employment growth has come about entirely from population growth”. Jobs have been filled by immigrants and native Australians joining or re-joining the labour force – people graduating from university, parents returning to work – rather than the unemployed.
The implication from this observation is that 3.5 percent may be a lower limit of unemployment.
Inflation – it’s closer to 3 percent than to 6 percent
Inflation, as indicated by the CPI, is on the way down. The usual media story, derived from a quick glance at the ABS CPI for the June quarter, is that inflation is 6.0 percent, down from 7.0 percent in March.
But that is an overstatement of inflation. A more qualified statement would be that “inflation, as indicated by the CPI, over the year to June, was 6.0 percent”.
We don’t have an official estimate of what inflation is now. But we do know that between March and June the CPI rose by 0.8 percent. That suggests that the annual rate over that quarter was 3.2 percent. Or if we go by the “trimmed mean” of 0.9 percent over the quarter, a measure that strips out volatile items, that suggests an annual rate of 3.6 percent. Either way, it’s close to the RBA’s two to three percent target range.
Does that figure of 6.0 percent have any validity? It does, in relation to indexation arrangements – an indexed pension, a business with an agreement with customers to raise prices in line with the change in CPI over the year, or an indexed employment contract.
But when it comes to the Reserve Bank trying to estimate the trajectory of inflation in the medium term, that 6.0 percent figure should have limited relevance. It’s mainly history.
What the ABS shows is that CPI inflation has been falling over the first six months of this year. It shows the following quarterly movements:
Dec quarter 2022 – quarterly rise of 1.9 percent, an annual rate of 7.8 percent;
Mar quarter 2023 – quarterly rise of 1.4 percent, an annual rate of 5.7 percent;
Jun quarter 2023 – quarterly rise of 0.8 percent, an annual rate of 3.2 percent.
That is, inflation is falling, rather quickly.
Of course the RBA should be guided by more than ABS headline figures. It should consider what’s driving inflation and assess if lifting interest rates will have any effect.
The ABS points out that inflation in services has been higher than in goods. This can lead to a chain of reasoning that because services are labour-intensive wage rises must be the cause of the rise. But it’s notable that the big moves in services have been in finance and insurance and international holiday travel. Higher insurance premiums are largely about the devastating effects of climate change, and the price of hotels in Bali or villas in Tuscany has little to do with Australian wages.
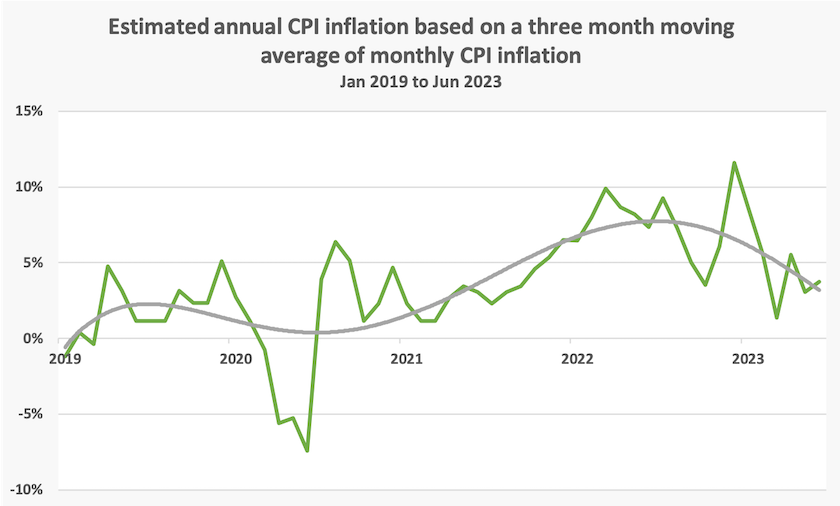
The ABS has also produced its monthly Consumer Price Indicator for June. It’s somewhat redundant when there is also a regular quarterly estimate. Its data is noisy, but it too suggests CPI inflation is on the way down, as shown in the graph below..
Inflation – who’s feeling the pinch?
Renters and people aged 30 to 34 are feeling the greatest pain of higher prices and higher interest rates.
That’s an (unsurprising) revelation in the Commbank iQ Cost of Living Insights Report, May 2023, which traces the pattern of spending over the last four years.
Although the Reserve Bank has been raising interest rates since April last year, and CPI inflation seemed to peak about August last year, cost of living pressure started to rise steeply only in December and has gone on rising since.
This is probably explained by people initially coping by drawing down savings, extending use of credit cards, and deferring some expenditures. That’s one reason why there is a lag in household responses to monetary and fiscal policies (and why the Reserve Bank, misunderstanding the dynamics of monetary policy, may have overshot).
The report shows how people’s spending has changed between the first quarter of 2022 and the first quarter of 2023, disaggregated by age. Australians under 55 have tightened their belts, while older Australians have gone on a spending spree. For example baby boomers aged 75 or older have boosted their spending by 13 percent. If we wander through town and observe full tables in restaurants and cafes, and crowds in shops, they’re probably much older than the customers of a year ago.
In terms of monetary policy, which is supposed to dampen demand, this suggests that the Reserve Bank has no chance of reining in spending by well-off older Australians. In fact, because many would have some interest-paying investments in their personal or superannuation portfolios, they could be made better off by higher interest rates.
The ABC’s Daniel Ziffer covers the same report: The boomers boosting inflation as the RBA lifts rates to fight it, with quotes from financial experts and those whose material standards have risen over the last year. His account is a reminder that there are many older Australians who realize that they have been unjustifiably privileged by public policies over the last twenty years, and are ashamed and annoyed that the government is doing very little to rectify these intergenerational inequities.
Contractors and consultants – public servants do a better job at half the price
Media attention is directed to two stories about possible corruption on the Coalition’s watch. One is about the Department of Home Affairs dealing with a businessperson convicted of corruption in its contracts to provide offshore processing on Nauru. The other is about a consultant and major donor to the Coalition disappearing from Australia when called upon to appear before the Parliamentary Joint Committee of Public Accounts and Audit in connection with his dealing with a former cabinet minister.
With their implications of criminal behaviour these cases capture the headlines, but there is emerging much more evidence of how the Commonwealth’s contracting out services once done by public servants has led to waste and poor public policy generally.
Julia Anaf and Fran Baum of the University of Adelaide have written in The Conversation that the big four consultancies have been giving advice that could influence public health, a policy area that should definitely be left to public servants because there are many possible conflicts of interest in consultants’ work for corporations and any advice they may give on health policy.
The Centre for Public Integrity has been consistently calling for more accountability around the Commonwealth’s use of contractors and consultants. Independent Member of Parliament Kate Chaney plans to introduce a bill to ban big Commonwealth contractors from making political donations as a way to lessen conflicts of interest.
Stephen Bartos of the University of Canberra has published in The Conversation a 3-point plan to untangle the public service from consultants such as PwC. His plan involves banning public servants from accepting gifts and hospitality from consulting firms, prohibiting public servants from obtaining employment in a consulting firm with which their former department does business, and changing Commonwealth procurement rules to require departments, before calling for tenders from outside the public service, to advertise internally for public servants to do the work.
The most recent Essential survey has three questions on public attitudes to the Commonwealth’s use of external consulting. Surprisingly perhaps, only a third of Australians have heard about the PwC misuse of confidentiality and know what it’s about. Older people are more aware of the issue, and are more in favour of regulations to rein in consultancies than younger people.
Do these age-related responses possibly mean that the issue has been better covered in newspapers and TV, the preferred media of older Australians, than in other media?
Options for workers on long-term casual arrangements
For some time now the Australian Industry Group has been warning about dire consequences of the government’s foreshadowed changes to conditions of employment for people on casual contracts but whose employment is continuing and long-term.
Writing in The Conversation John Buchanan of the University of Sydney, one of Australia’s most respected authorities on employment conditions, explains that changes for casual workers are about accepting reality. That reality is “if a worker is effectively working as a permanent employee, they have the right to be treated as such”.
There are already provisions in National Employment Standards specifying that a casual employee who has worked for their employer for 12 months must be offered the option to convert to permanent employment. But as Buchanan explains, there are exemptions, particularly for small business. (Why is “small business” so sacred in Australia?). Consequently about 60 percent of “casual” workers have been with their employer for more than a year.
As the Minister for Employment and Workplace Relations explains, the government’s change is entirely about giving workers more choice. “No one will be forced to convert from casual to permanent if they don't want to”. Those who convert to permanent employment will lose their casual loading, and in return will receive the benefits of sick and recreation leave.
Sick leave is not only a personal benefit: it is also a public good. We might recall how casually-employed workers were disadvantaged during the Covid-19 wave, many probably coming to work while ill, making it harder for public authorities to control the pandemic. Presenteeism – battling on at work while sick – is a hazard to productivity.
Measuring what matters – the ABS was doing a better job 10 years ago
On 21 July Treasury released what it calls “the first iteration of Australia’s wellbeing framework”, the Measuring What Matters Statement.
This is the really the present government’s second go at a wellbeing report. The government actually produced its first “Measuring What Matters Statement” in Budget Paper 1 last October. That was a hastily-cobbled-together piece of work. This document is more structured and much more detailed. It is built around five adjectives describing social ideals – “healthy”, “secure”, “sustainable”, “cohesive” and “prosperous”. At this high level most people would consider these ideals to be uncontentious.
At the more disaggregated level the authors of the work seem to have taken care to choose indicators on which there would be broad agreement on where progress would lie – “homelessness”, “climate resilience”, “time for recreation and social interaction” to name a few of the many. But there could be some contention around other indicators. It is easy to think of people who do not want to see a reduction in “income and wealth inequality”, for example. There is a set of statements around “secure jobs”, implying that work security is desirable, but some economists would argue that an economy with high job security would be a stagnant one.
In its economic indicators it points out that real net national disposable income per capita has risen from $48 500 in 2002-03 to $68 100 per capita, a growth rate of 1.8 percent a year. But it also points out that labour productivity has been falling. These are key indicators.
Strangely it finds that over the last ten years wealth inequality has been “stable”, but this is because it covers only the financial aspect of wealth inequality, ignoring inequalities in social, human and environmental capital, all important aspects of wealth. Also measures of household wealth are heavily influenced by the market value of housing, which is largely unrelated to the real value of housing in terms of shelter, safety and locational convenience.
One telling figure is that the proportion of people unable to raise $2000 within a week when needed, has increased from 18.5 percent in 2006 to 21.85 percent in 2019. That’s an indicator not only of cash and credit reserves, but also of social connection (particularly noting that $2000 is worth 25 percent less than it was in 2006). That figure, and other indicators of financial stress, are drawn from the ABS General Social Survey: all figures in that survey point to increasing financial stress, well before Covid-19 arrived and before the Reserve Bank’s most recent adventure with interest rates.
It has a “dashboard” (resurrection of a quaintly old-fashioned term) allowing one to look at indicators under the five dimensions, but at higher levels of disaggregation. Confusingly the categories in the main report and in the “dashboard” differ. Also in the main report figures on income and wealth are provided in real (inflation-adjusted) terms, while in the ”dashboard” different measures are used and they are in nominal terms.
The opposition has criticized the report. Shadow Treasurer Angus Taylor says it’s “out of date and out of touch”, before going on to suggest the last 11 interest rate rises have been the fault of the present government and that “typical Australian families are already $25,000 worse off than they were a year ago”. He has form in making up numbers.
But exercises like this are about longer-term trends, not the swings and roundabouts of fiscal and monetary management. Taylor’s claim about the data being out of date is hypocritical: one of the Coalition’s first actions on being elected in 2013 was to abolish the ABS Measures of Australia’s Progress project, which had involved a large amount of government and other investment, and which was starting to yield some significant time series.
Criticism can be levelled at the government, however, for including under each of the five headings a list of dot points on key government initiatives. The ABS Measures of Australia’s Progress was deadpan, with straight presentation of data, leaving it to the user to make their political judgements. These inclusions of government initiatives detract from its credibility.
Writing in The Conversation John Hawkins and Jacki Schirmer of the University of Canberra, say Cheap shots aside, Chalmers has work to do to improve his new “wellbeing” framework. They dismiss Taylor’s criticism of the report, but they point out its limitations, particularly its concentration on averages rather than the distribution of outcomes on key variables. They illustrate this point with a short illustration of the distribution of unemployment by broad regions and First Nations compared with other Australians. They conclude that “it is a step in the right direction” however.
Also in The Conversation Warwick Smith of the University of Melbourne writes about the general concepts behind wellbeing indicators, here and in other countries: Today’s Measuring What Matters statement is just a first step – now we have to turn goals into action. To understand whether we are making progress to a wellbeing economy we need more than a “dashboard”. Drawing on the work of the Wellbeing Economy Alliance he lists five tests of a “genuine wellbeing economy”:
- Does the economy provide everyone with what is needed to live a life of dignity and purpose?
- Does the economy restore, protect, and cherish the natural environment and is the economy guided by the principles of interconnection and indivisibility of human, animal, plant, and environmental health?
- Does the economy value activities and behaviours by their contribution to social and ecological wellbeing?
- Is the economy designed to ensure a just distribution of income, wealth, power, and time?
- Is the shape and form of the economy locally rooted and determined by people’s active voices?
Behavioural economics – a guide to good public policy or psychological manipulation?
Towards the end of last century the discipline of behavioural economics arose. Its concern is to study how people make choices in situations involving money.
It is a complement to the established economic theory of how people make choices, assuming they are rational, well-informed actors, making decisions in their own self-interest. Behavioural economics considers policy questions such why people save inadequately for retirement, why people waste money on unnecessary insurance, why people buy and sell shares at the worst possible times, why people get sucked in by promotional tricks and other departures from the “rational” model.
A vast amount of rigorous and well-researched work on behavioural economics has been developed. At the same time, as in any discipline, there has also been a fair bit of published material based on anecdote and poorly-designed experimental conditions.
One particularly influential work has been the 2008 book Nudge: improving decisions about health, wealth and happiness. It’s a well-written work by two serious scholars, Richard Thaler and Cass Sunstein. Its main message is that with a little nudge, rather than compulsion, people can be helped to make decisions that overcome behavioural biases that lead them to act against their own interest. All very ethical.
Unfortunately, however, policymakers can also use those same nudges to steer people to do things that aren’t in their self-interest. Nudge can be used as a handbook by politicians and their advisers who seek to use the dark arts of advertising and marketing in making public policy that isn’t in the public interest. (Perhaps by a prime minister who has a background in marketing.)
Writing in The Conversation Peter Martin explains how behavioural “experts” quietly shaped robodebt’s most devilish details – and their work in government continues. He finds that psychological nudges were used to entice people to pay conjured robobdebts at all costs.
Martin, once a behavioural economics enthusiast, has become skeptical about it. He notes that there is a behavioural economics team in the Department of Prime Minister and Cabinet, and while acknowledging that behavioural economics can contribute to good public policy, such as lifting organ donation rates, he is concerned about its possible misuse.
I have more faith in behavioural economics than Peter Martin has – see for example an article in the International Journal of Behavioural Accounting and Finance, and a conference paper at the Australian Economic Forum. But I agree with Martin that the insights from behavioural economics can be used in ways that do not serve the public interest.