Other economics
Well-being – we coped with the pandemic better than we have coped with its aftermath
The 2022 Australian Unity Wellbeing Index has been published. This is a long-established regular survey, with time series covering the last 20 years.
It relies on subjective indicators of people’s wellbeing, covering people’s satisfaction with their standard of living, their health, achievements in life, personal relationships, safety, community connectedness, and future security. The authors present indicators for each dimension and they also combine them into a single personal well-being indicator.
It reveals that while Australians’ subjective well-being remained remarkably resilient in 2020 in the face of the challenges posed by Covid-19, our well-being has fallen in 2022, in most dimensions. The only significant improvement has been in “personal safety”. The worst fall has been in “community connectedness”, which Australian Unity sees as falling below what it calls its “normative range”. That is, it’s a bad outcome.
Also concerning is that the personal well-being index has fallen below the “normative range” for respondents aged 18-25. It also finds that younger people are significantly more prone to stress, anxiety and even depression than older people.
It is hardly surprising that among income groups the greatest falls in personal well-being between 2020 and 2022 have been among those with lower household income, while well-being has remained high and almost unchanged among those with household incomes above $150 000. That’s probably a reflection of falling real wages and stingier unemployment benefits. Broadly similar results are found in relation to employment: it has never been much fun being unemployed, but the experience of being unemployed has become worse since 2020.
These time series suggest that socio-economic divisions in Australian society are widening, particularly in the two years to 2022.
Its spatial data does not go beyond a capital city/rest-of-state division, but it notes a particularly sharp fall in Queenslanders’ personal well-being indicators. The ACT too has experienced a sharp fall, but this has been from a high base.
The report covers surveys on attitudes to climate change. Young people are much more worried about climate change than older people, and are (quite reasonably) concerned that they will be more personally impacted by climate change than older people. Young people are more confident, however, that climate change can be kept under control (a greater faith in technology perhaps?).
To quote the authors “One key theme that emerged was that young people are struggling in Australia, both with mental distress and climate concerns, which may very well be interconnected.”
At last some disciplined thinking about regions
Whether you live in Balmain or Bourke, Toorak or Tibooburra, you live in a region.
This geographic reality has eluded journalists and other commentators, who reserve the word “regional” for all of Australia that falls outside our capital cities, as if those capital cities are homogeneous blobs.
But the reality is that our capital cities are massive conurbations, with distinct regions within them.
The map below, compiled from the ABS 2021 Socio-Economic Indexes for Areas, as an example, shows Sydney as a patchwork of relative advantage and disadvantage. There are clear regional clusters within this map.
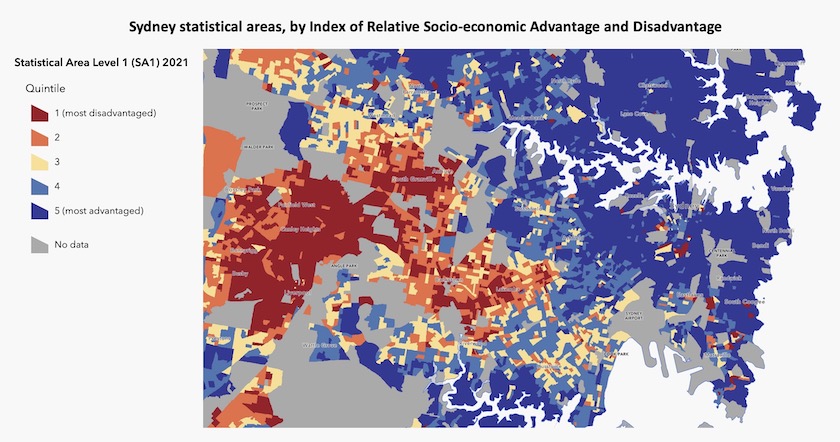
The ABS website has links to allow users to generate such maps, at various levels of area disaggregation (the map below is the smallest such disaggregation), and in terms of four layers of advantage and disadvantage. One layer, for example, is of education and occupation. If you generate your own maps you will find that rankings in these dimensions correlate fairly closely.
Even before you get to the stage of mapping, however, you will see that the ABS website lists the ten most advantaged and the ten most disadvantaged local government areas (LGAs). Six of the ten most disadvantaged are in Queensland and the other four are in the Northern Territory, at various distances from Brisbane and Darwin. Of the most advantaged, six are in New South Wales, three are in Western Australia and one is in the Northern Territory. All are urban – Sydney, Perth and Darwin.
But to suggest that there is some clear capital city/rest of Australia divide is too simple. A cluster of LGAs in western Sydney around Fairfield are in the same lowest quintile as LGAs In western Tasmania and outback South Australia. At the other end of the scale some rural LGAs are in the same top quintile as those around Sydney’s north shore.
The ABC’s Markus Mannheim has been looking at the data, pointing out that at a gross level Canberra is the most advantaged capital city in Australia: Socio-economic data suggests the “Canberra bubble” is real, though it also hides disadvantaged residents. But Canberra too has its regions of advantage and disadvantage, the most disadvantaged regions, as in some other capitals, being those most distant from the city centre. This is an unfortunate reflection on the failure of Canberra’s original vision, which was supposed to provide a model of socio-economic mixing for other urban areas to follow.
It should be noted that the ABS report is based on 2021 census data, before the rental situation became so tight. The rental crisis is most strongly manifest in capital cities, particularly Sydney and Melbourne.
Another report on small-area well-being is produced by SGS Economics in its Cities and Regions Wellbeing Index. Their index combines many variables – economic activity, income, wealth, human capital, housing, health, equality and environment – into a single well-being indicator for a number of regions, with some disaggregation in cities, but not as finely divided as the ABS disaggregations. Although it confirms the generalization that people living in capital cities enjoy a higher level of well-being than people living in the rest of Australia, smaller area data reveals a different and more complex picture. It finds a negative correlation between well-being and distance from a state capital, but it’s a weak correlation. There are regions of disadvantage within cooee of the capital city CBD and regions of advantage in the outback.
When we look at the ABS maps, particularly using the education and employment layer, we find areas of advantage not only in our capital cities, but also in our large provincial cities, which have been taking in people from the surrounding rural hinterland, and often have tertiary education institutions. This development has been in train for many years in the United States as Atlantic editor Ronald Brownstein points out in his article Republicans’ Big Rich-City Problem. These islands of urban liberalism are swinging Congressional districts, to the detriment of the Republican Party.[1] The National Party should take note.
Australia, like other countries, has a complex patchwork of regions. The popular “capital city”/”regional” classification has to go: it is too simplistic for meaningful guidance on public policy.
1. This trend may shift the US House of Representatives composition in time, but the US Senate is elected on the basis of only one vacancy at each election, which means small rural states could keep on returning right-wing senators. ↩
Infrastructure
Inland rail
In the roundup of 15 April were links to Kerry Schott’s review of the inland rail project, along with links to other comments and analysis about the project. In short, the present government has inherited a costly mess from the Coalition – a project that was poorly planned, poorly managed, and is subject to substantial delays and a massive cost blowout, from $9 billion as originally announced to at least $31 billion.
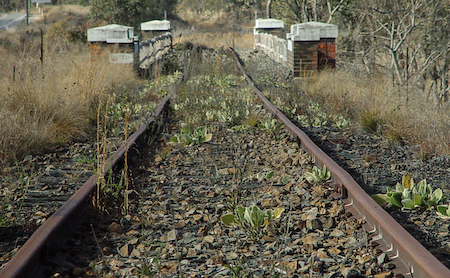
An earlier inland rail
The project was commenced before the route had been fully planned, particularly its connections to ports in Brisbane and Melbourne, and there was little consideration of the way it would pass through flood plains in northern New South Wales. Those terminating connections, involving new lines through urban areas to link with ports, were bound to be the most organizationally complex aspects of the project, but they weren’t on the project’s critical path.
The government’s response to the Schott report is essentially a promise to improve the project’s governance and management, putting it into the hands of people with the expertise to manage such a difficult task. Some may have believed that the government would cut its losses, and terminate the project at Parkes, which would still provide an improved rail service between Melbourne and Sydney and between Melbourne and Perth, but a reading of the government’s press release suggests that it has decided to go ahead with the original project with only minor changes.
On the ABC’s 730 Report of 3 May (from 17:12 to 24:19) is a lively discussion among protagonists with views on the project, including Everald Compton who convinced the Coalition to commit to the project 25 years ago. The main issue under consideration is how the rail will connect with the port of Brisbane – whether it will terminate at Ebenezer, on the western fringe of the Brisbane conurbation, which is the current plan, or if it will terminate at Toowoomba. The consensus seems to be that bringing the line down from Toowoomba to Ebenezer, involving a 700 meter descent, would be too expensive.
More on that Hobart stadium
The May 6 roundup has a report on the Commonwealth’s decision to contribute $240 million to a new stadium in Hobart – a project for which there is no economic case for public funding, and which has a negative net present value.
Martyn Goddard, in his Policy Post, looks at the project from a Tasmanian perspective: That very silly stadium in Hobart. He goes into the benefit-cost analysis in detail, points out that even the existing stadium at Bellerive has never been full, and notes that attendance at football matches has been falling. He also points out that, if the $240 million spending goes ahead, under the Commonwealth-state agreement for distribution of payments to the states it would essentially be at the expense of other Commonwealth funding for Tasmania. He goes on to describe how that money could be far better used for Tasmanian projects with positive benefit-cost ratios.
The stadium has precipitated a split in the state’s governing Liberal Party, which is now governing in minority. The two members who resigned from the party and now sit as independents are reported to be concerned about debt and transparency issues around the stadium. It is also notable that they are from electorates in the north of the state. North-south conflicts in Tasmania pre-date the Liberal Party by at least 100 years.
In spite of these defections, state funding appears to be secure, but if Labor and the Greens can get together with the two independents they could have state funding blocked, thus allowing the Commonwealth to back out of its commitment.
In spite of the lack of justification for public funding of elite spectator sports, the Commonwealth Minister for Infrastructure, Transport, Regional Development and Local Government is strongly in favour of such projects. In her budget statement, in which she announces her intention to review the infrastructure investment program inherited from the previous government, she also mentions the $240 million stadium project, dressing it up as an “urban renewal” project.
The irony of this juxtaposition seems to have escaped the attention of the public servants who wrote her press release. If road and rail projects were to be funded with the same ease as sport stadiums, by now we would have a high-speed rail line from Brisbane to Adelaide, a high-standard road between Melbourne and Adelaide, and metro systems in all our capital cities.
If one were to assess this fiasco in terms of political winners and losers, neither of the two main parties comes out well, and the last remaining Coalition government could be the next victim, as explained by Tasmanian ABC reporter Adam Langenberg: Opponents to the Hobart AFL stadium have a “nuclear option” in next week’s state budget. The only winner, so far, seems to be the AFL, which has managed to bully governments into building stadiums. The losers are the 90 percent of the population who have something better to do with their Saturday afternoons than to watch people kicking a ball around.
Don’t ask how the US banking system works – you might spoil the party
One of our readers has sent a link to a podcast on Robert Sheer’s website: 4 US Banks Crash in 2 Months: Banking Crisis Explained by Economist Michael Hudson.
Hudson is professor of economics at the University of Missouri-Kansas City. We might expect anyone with Hudson’s blue-ribbon background – his first degree from the University of Chicago, employment in Chase Manhattan Bank – to be well on the side of big finance, but he is deeply critical of the laissez-faire free market, which has allowed the non-productive finance sector to extract rent from the real economy.
In this interview Hudson reflects on the most recent US bank collapses, most recently the First Republic Bank. He explains that the “entire US banking system” is just as insolvent as the four that have collapsed. US banks are insolvent because their assets – loans and bonds with low interest rates – have lost value as interest rates have risen, but their balance sheets have been supported by federal guarantees, and they have been kept liquid by wealthy depositors who have had nowhere better to park their money. This deal is underwritten by $9 trillion of Federal Reserve balance sheet support.
His analysis has a 1929ish tone – so long as no one questions the fundamentals of the deal, it will go on – until it doesn’t.
Although Hudson’s interview is very much about the current problems facing US banks as rising interest rates reduce the real value of their assets, it also provides some insight to the period of low rates between 2009 and 2019, when the US, and the “developed” world generally, became awash with money, driving up asset prices, including housing, creating an illusion of wealth while the real economy languished.