The budget, a coronation somewhere distant from Australia, and an absence
There will be no roundup next week: I’m heading on a cycle trip, away from the Internet and other media, which will be full of an event in one of Europe’s offshore islands with little relevance for Australia, and the budget.
Understandably a fourth-generation Australian isn’t very interested in England’s monarchy, but how can a policy wonk miss the excitement of the budget?
Easily, because there is so much pressure on journalists and community organizations to write something, so much attention to the budget speech, so much attention to a few headline numbers, that it’s a few days at least before any considered comment arrives.
For those who will be following the budget, below are a guide to some things to look out for, and a summary of The Grattan Institute’s views and opinion polling.
Making sense of the budget
The budget speechIt’s a carefully-choreographed political exercise, to be listened to with scepticism, but it’s the only place where you can get a feeling for the government’s overall economic principles. While previous treasurers have tended to emphasize the government’s fiscal policies, Chalmers is likely to put some weight on the economic policies, particularly as they relate to well-being.
But there will surely be statements of initiatives and the millions the government is spending on them. Here are a couple of simple pieces of arithmetic that will help put any such figures into context.
1. Divide appropriations by 100
There will be announcements of $X million to be spent on various programs. Do a little mental exercise and divide X by 100, to get a feeling of the importance of the allocation.
Why 100?
If the Treasurer says $100 million will be spent on repairing the nation’s highways, helping people with chronic disease, or promoting the arts, the spending is usually over the four-year forward estimates period. So divide by 4, which comes to $25 million a year. There are just over 25 million people in Australia so it’s about $1 a head. That’s the rounding error on your tax return.
2 Subtract a few percentage points from growth estimates
If the Treasurer says funding for schools or Medicare will rise by Y percent in the coming year, check whether that’s a real or inflation-adjusted growth. If there’s no claim that it’s inflation-adjusted subtract at least 3.5 percentage points to cover inflation, that having been the government’s inflation estimate in last year’s budget. And subtract, say 1.5 percent, for population growth. So any allocation or revenue source that does not grow by 5 percent or so is a reduction in per-capita terms.
Unless it’s something about a specific project or program of interest, ignore new appropriations or cuts less than $1 billion, and program increases less than 5 percent.
Wednesday’s media reports
The morning-after reports these days are an improvement on “beer up, cigs up”, the tabloid headlines of times past, but they are usually superficial because of the conditions in which they are prepared, the lockup.
The process used by the government to release the budget to the press is almost straight out of Kim-Jong Un’s instruction book on media relations. At around 2 pm on Tuesday, journalists and others from lobbies and community organizations will be allowed into the lockup, where they will be given a set of budget papers. There will be ministerial advisors and public servants on hand to answer questions, and probably the occasional minister.
No communication with the outside is permitted. If anyone wants to look up an ABS statistic or a previous budget to do comparative analysis, they can’t, unless they have pre-loaded those documents on their laptop or other portable device. There are hundreds of pages of budget documents, supplemented with press releases and other special statements. Journalists and others are in a hectic rush to get something written before 7 pm, when they can get their copy into print and on to websites for the morning.
To get a feeling for the atmosphere consider an airport on Christmas Eve, or an Indian railway station at rush hour. Hardly conducive to considered analysis.
Wait a few days until experienced journalists such as Peter Martin, Ian Verrender and Ross Gittins, and independent institutes such as the Australia Institute and the Grattan Institute, have had time to analyse the budget and give their views on how its measures will affect national prosperity. And wait a few more days until organizations such as ACOSS and others with specific interests have uncovered the fine detail.
Budget aggregates – the macroeconomic context
For most people interested in public policy, the most important document is Budget Paper No 1: Budget Strategy and Outlook. It will be on the Treasury website www.treasury.gov.au. Unlike the budget speech, Budget Paper 1 is prepared to a fairly standard template and is reasonably free of political spin.
Unless there is a departure from long-standing conventions, there will be two tables, pretty well up front, one on economic assumptions and projections, and one on budget calculations.
Below are extracts from last October’s budget that relate to this year’s budget (which will have projections to 2026-27). Real wage growth is shown in blue because it is not one of the published figures but it is implicit in the figures on the CPI and the wage price index.
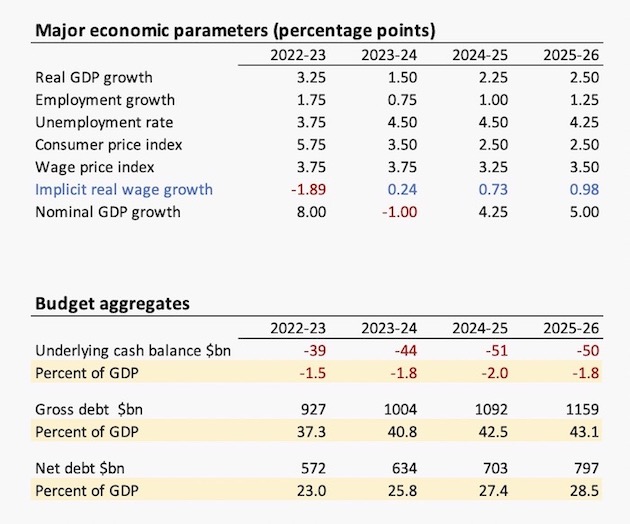
Because there is so much attention paid to the cash balance – far more than is justified economically – governments tend to overestimate the size of the expected deficit in their projections, and to come in with a smaller deficit in the budget. It’s the old tactic of underpromising and overdelivering. In the October 2022 budget the government estimated a comparatively low price for iron ore, for example.
Tax cuts
There is a great deal of speculation about whether the government will go ahead with its promise to implement the Stage 3 tax cuts.
Below is a presentation of the present income tax rates (excluding Medicare and the Low Income Tax Offset) in blue and the proposed cuts in the red line.
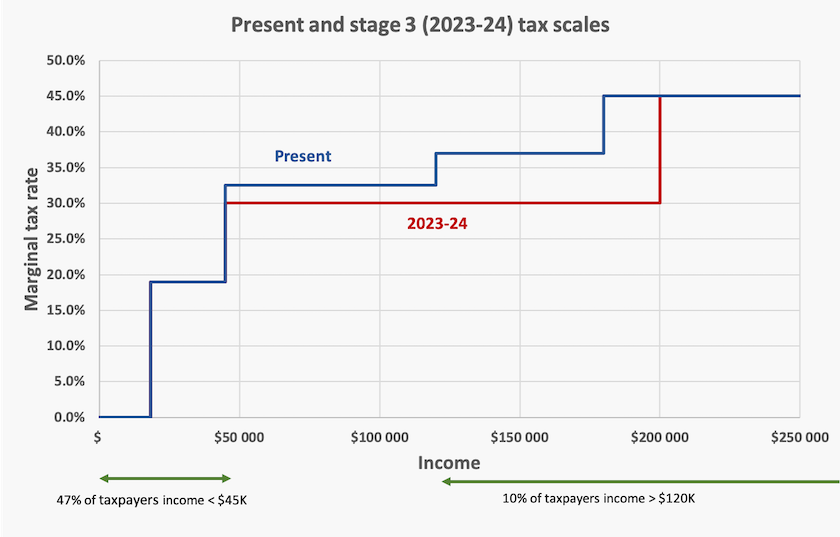
Shifting the threshold for the 45 percent rate, from $180 000 to $200 000, has commanded quite an amount of attention, because it looks bad in the current economic circumstances. But that’s been the threshold since 2008, over which time there has been a 56 percent rise in the CPI. In that context an 11 percent rise doesn’t look unreasonable.
The most costly aspect of the cuts is abolition of the 37 percent step, which currently cuts in at an income of $120 000.Many people in mid-range professional jobs – graduates with ten or so years of experience – have incomes in the $100 000 to $200 000 range. The government would be well aware that these taxpayers are heavily represented among voters who have been deserting the Coalition in recent years. Also among those tax payers would be many who may be enjoying a good income, but who have gotten themselves heavily committed to mortgage debt.
What’s in it for me?
On Wednesday there will probably be “what’s in it for me?” tables in the press. Those changes in income taxes, pensions and social security payments have a short shelf life. Even if your concern is only about your personal material standards, your prosperity in the medium to long term will be influenced far more by policies that shape the nation’s economic structure, such as policies on our energy transition, education, infrastructure and immigration.
The Grattan Institute’s budget
Danielle Wood of the Grattan Institute is the author of a Saturday Paper article Albanese’s three biggest budget challenges. These are inflation and the associated cost-of-living squeeze on households, demands for better unemployment benefits, and the increasing size of the structural budget deficit. The structural deficit is essentially the deficit that would result if there were to be no change in tax scales or in government programs and if the economy generally continued on its path of growth.
Because many government services, including health care, care for the aged, policing and education, are intrinsically labour-intensive, and because ageing populations increase demand for pensions and health care, in most “developed” countries the structural deficit is bound to grow over time. That is, unless public revenue is increased.
The Grattan Institute has a well-researched document Back in black? A menu of measures to repair the budget, recommending a number of ways to improve revenue. They include redesigning the Stage 3 tax cuts, winding back income tax breaks (particularly for superannuation), and raising the GST.
That covers the revenue side. Growth in the structural deficit can be arrested for a time if savings can be found in government spending without affecting service delivery. The authors find modest but still substantial improvements in areas such as in infrastructure and defence spending where there is evidence or poor expenditure management and waste in recent years. Much of this waste is a consequence of privatization and contracting out government services.
The people’s budget
The May 2 Essential Report has a set of questions about people’s knowledge of the budget and what they would like to see in the budget.
Most of us (59 percent) don’t feel that we are well- informed about the purpose and significance of the budget.
Essential put to respondents eight statements on the budget, four of which are correct (e.g. that it’s about “how the government intends to spend and allocate money in the next financial year”) and four that are incorrect (e.g. that it’s about “the interest rates for the next financial year”). At best we score a “pass” mark. Older people do much better than younger people.
When asked about our attitudes to public spending, our priorities, in order, are health, education, and social security. NDIS, defence and renewable energy are on the next rank down. Older people are strongly in favour of spending on health and social security. There are predictable partisan differences, but they’re not strong. Those priorities are not surprising: polling over many years reveals consistently strong support for spending on health and education, while other priorities tend to shift around.
There are questions on tax, asking respondents if they think particular taxes are too high or too low. It’s pretty meaningless to interpret absolute figures on taxes unless they are in a broad context of public benefits, but the ranking is revealing. Taxes on superannuation and savings, on property, and on income, all rank about the same level of popularity/unpopularity. The GST is less unpopular/more popular than these other taxes – surprising in view of the government’s terror about any hint of a rise in the GST. But unsurprising is the public’s strong support for taxes on international corporations and oil and gas producers. Coalition voters are much more likely than others to think taxes on property and on oil and gas producers are too high.
Respondents are asked to choose between two priorities for the budget:
“The government should prioritise providing support for people and industries struggling to manage rising cost of living, over the reduction of national debt.”
“The government should prioritise the reduction of national debt by cutting public funding for services or increasing revenue through taxes.”
On this choice spending wins hands down (78 percent) over debt reduction (22 percent). Even among Coalition supporters spending commands a strong preference (70 percent to 30 percent).
There is a question about whether people support a rise in Jobseeker benefits. Labor and Greens voters are much more in support of a rise than Coalition voters, as are renters, but overall we’re only weakly in support of higher benefits. Even when respondents are informed about the present dollar value of benefits, their support hardly shifts.
The survey starts with a couple of questions about the Treasurer and his popularity. Only a third of us can name him. He’s traveling well among Labor voters, but there’s less affection among Greens and Coalition voters. It’s hard to think of a treasurer who has enjoyed high popularity.
Measuring what matters
In line with Labor’s pre-election promise, and in line with practices in some other countries, last October’s budget included a new section in Budget Paper 1: “Measuring what matters”. This was the first round in a regular presentation of a set of wellbeing indicators.
That section gave every indication of having been cobbled together rather quickly. There has been an initial round of consultations, and it appears, from a subsequent consultation draft, that the government is moving towards a set of indicators that can describe aspects of wellbeing, under five headings:
- Prosperous: A growing, productive and resilient economy;
- Inclusive: A society that shares opportunities and enables people to fully participate;
- Sustainable: A natural environment that is valued and sustainably managed in the face of a changing climate for current and future generations;
- Cohesive: A safe and cohesive society that celebrates culture and encourages participation;
- Healthy: A society in which people feel well and are in good physical and mental health now and into the future.
These headings, and the sub-headings under them, are all fairly general. There are few statements with which any reasonable person would disagree. The difficult task lies in finding meaningful indicators. In some areas, such as climate change, there are many indicators, but what indicators can be found, or developed, for “A society in which people are generally satisfied with their life”, one of the sub-headings?
Notable for its absence is the lack any suggestion that inequality in wealth or income should be measured. The headings and sub-headings, particularly the second heading, stress equality of opportunity, and some others imply the desirability of a minimum material standard, such as “A society that allows all people to afford life’s essentials”. But there is no suggestion in these draft statements that reducing disparities in income or wealth can be seen as something worth measuring.
Maybe the authors are fearful of being seen to be in favour of equality of outcome – communism got a bad name last century. But even some of capitalism’s strongest defenders warn that inequality, when it reaches extreme levels, is a threat to prosperity and good order.
In any event, inclusion of an indicator does not mean the government is making a normative statement. The government’s task is to provide the framework and the data: it is up to citizens to interpret whether those indicators are “good” or “bad”.
There is only a short period for consultations, which close on Friday 26 May.