Health policy
Australians are being bludgeoned into private health insurance
One of the first things the Howard government did upon being elected in 1996 was to re-introduce incentives for people to hold private health insurance. The Coalition, impervious to evidence or reason revealing the economic waste of private health insurance, has always harboured a visceral hatred of Medicare.
A number of incentives were applied to get people into private insurance, including what is known as the Medicare Levy Surcharge, a levy on taxpayers with an income above a threshold who do not hold at least basic hospital insurance. When the Howard government introduced it in 1997 it was described as a surcharge for “high income earners”. The most significant component of support for private health insurance is in the form of direct budgetary subsidies for premiums, presently costing around $7 billion a year. But the Medicare Levy Surcharge is another, less visible subsidy.
One reader has reminded me that the threshold at which the surcharge is applied has been held unchanged since 2015. Since then nominal incomes have risen, and now the surcharge is applied to people with modest earnings.
The thresholds for the surcharge and the rates of the levy are described in detail on the ATO website. The levy is on a sliding scale between 1.0 and 1.5 percent of income, and the family threshold is twice the single threshold. To illustrate the effect of non-indexation I have plotted on the graph below the single threshold (the blue line, noting that it’s been flat at $90 000 since 2014-15), and average full-time earnings (the red line).
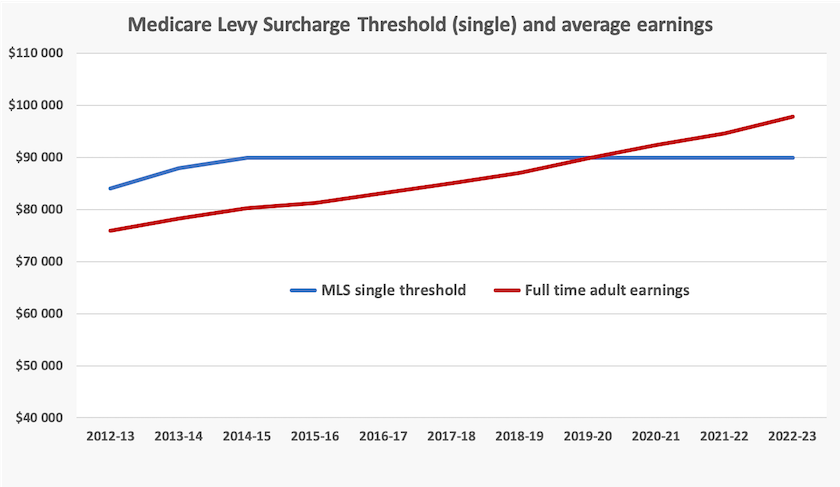
Because the surcharge threshold is now not indexed it has gone from around 10 percent below full-time earnings to around 10 percent above full-time earnings. Notably, in Treasury’s Tax Expenditure and Insights Statement released on Tuesday, there is no longer any reference to “high income” in its description of the levy. The surcharge has been surreptitiously providing an increasing level of support for private insurance.
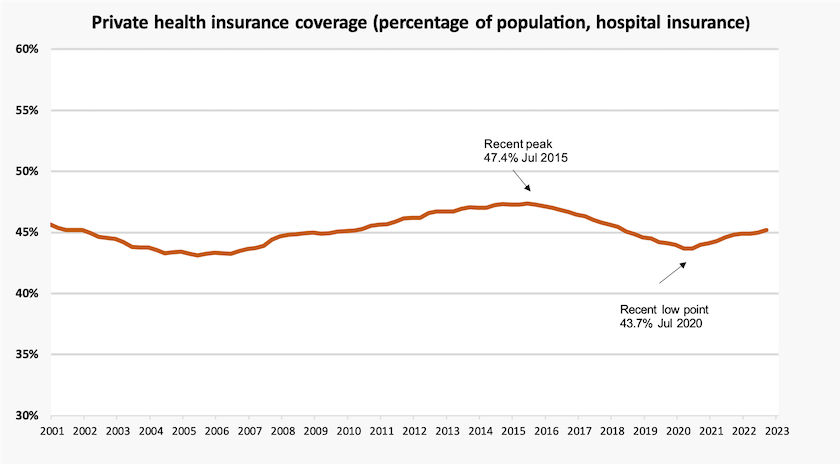
From 2015 to 2020, in a promising trend, private health insurance coverage had been falling: it appeared that in time this high-cost distortionary burden on our health care systems would wither away to join other health hazards such as cigarettes, leaded gasoline and coal-fired power stations. But since then it has started to creep back up. Possibly the non-indexation of the thresholds has been a contributing factor, although comparatively modest premium rises in recent years may have also contributed to this recovery.
Treasury, in its Tax Expenditure and Insights Statement, (Page 33) treats the surcharge as a “negative tax expenditure”, as if it is a fine or penalty applied to those who do not have private insurance, noting that in 2019-20, 440 000 Australians paid the surcharge.
That’s an ideological framing of the surcharge, implying that people with income above the threshold shouldhold private insurance. That is, they should opt out of the tax-funded public hospital system and move to their own health care gated community.
It would be more in keeping with the notion of universality if exemption from the surcharge enjoyed by people with private insurance were treated as a positive tax expenditure. That is to see it as an expensive subsidy to the private insurers. In 2018, using conservative assumptions, I estimated the cost of exempting private insurance holders from the surcharge at $2.5 billion. It is surely much higher now after another four years of non-indexation.
If the Albanese government were committed to Medicare as a universal public health insurance system, it would not permit the Treasury to convey the implicit message that those who can afford private insurance (incomes over $90 000 single, $180 000 family) should hold it or be fined.
Rather, if the levy were framed as a normal “positive tax expenditure”, the implication would be that the levies of 1.0 and 1.5 percent should apply to everyone, regardless of their private insurance status, boosting public revenue by at least $2.5 billion and helping to pay for Medicare. (In fact there is an arguable case for subsidizing high-income earners without private insurance, because many of them will pay for their own private hospital costs without drawing on the government direct subsidy for private health insurance.)
In 1972 and 1974 the Whitlam government put everything on the line, including a double-dissolution election, to establish a universal tax-funded system of health care. The Rudd-Gillard government, however, continued the Coalition policy of making publicly-funded health care into a system for the poor and “indigent” (to use the American term), rather than a shared service. Is the Albanese government willing to re-instate the original principles of Medibank and Medicare?
Bulk billing – a statistical correction
To date the government has been publishing figures on the number of medical services that have been bulk-billed. Martyn Goddard, in his Policy Post, points out that there is a basic difference between the number of services that are bulk-billed and the number of GP attendances that are bulk-billed. That’s because in one session – one attendance – there can be several services provided, some of which are bulk-billed, while the major service, the GP consultation itself, is subject to a large co-payment.
Goddard’s post – In the state that needs GPs most, they’re more out of reach than ever – explains that difference, and how the burden on consumers of co-payments is greater than implied in published data on bulk-billed services. He has an emphasis on Tasmania, where the problem is most acute, but he provides basic data for the rest of Australia.
Covid-19 – still around and still killing Australians
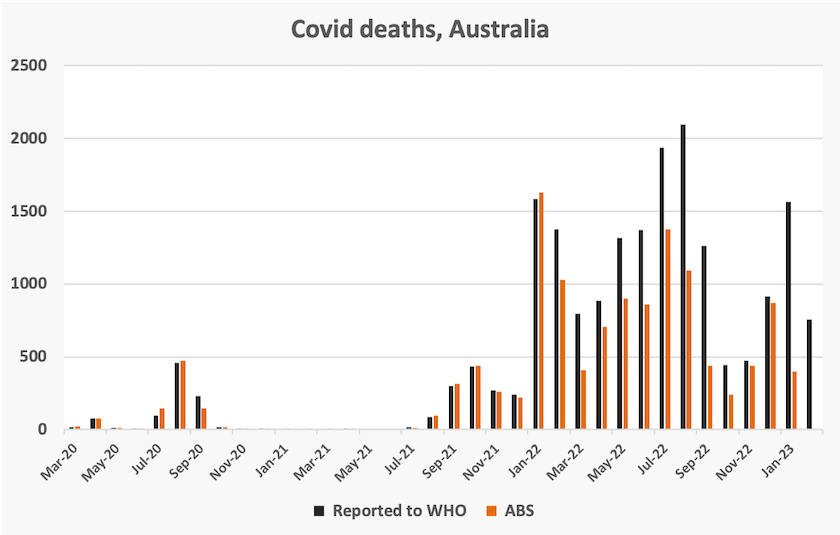
The graph below shows two series of Covid-19 deaths by month – as reported to the WHO (dark gray), and as recorded by the ABS (orange). The difference is largely explained by the fact that the ABS in its data on Covid-19 mortality counts only those deaths for which the underlying cause was Covid-19. Of all deaths associated with Covid-19, in 80 percent of cases Covid-19 has been the cause of death while in 20 percent it was recorded as only a contributing factor. The data reported to the WHO is also influenced by lumpiness in reporting, while the ABS has been more diligent in tracing the date of deaths.
Apart from its monthly totals, shown in the graph, the ABS data is mainly a consolidation of data collected over the three years that Covid-19 has been a cause of death. It provides comprehensive data on the age of people who have died from Covd-19 (age 86.0 for the Australia-born, but lower for some immigrant groups), gender (disproportionately male), and socio-economic status. The ABS reports that “the number of people who died due to Covid-19 was around 3 times higher in those in quintile 1 (most disadvantaged) than those in quintile 5 (least disadvantaged)”.
It also reports that “chronic cardiac conditions were the most common pre-existing chronic condition for those who had COVID-19 certified as the underlying cause of death”.