Economics
Income distribution
The ever more-justified case for abandoning the Stage 3 tax cuts
By now public servants in Treasury would be reasonably advanced in preparing the 2023-24 budget, to be presented in May. That budget will include the already-legislated Stage 3 cuts, unless the government specifically abolishes or modifies them. These tax cuts would eliminate the present 37.5 percent tax bracket, and reduce the marginal tax rate to 30 percent for all taxpayers with incomes between $42 000 and $200 000. They would be of significant benefit only to those 10 percent of taxpayers with incomes above $120 000.
That flattening of the tax scales is illustrated in the diagram below.
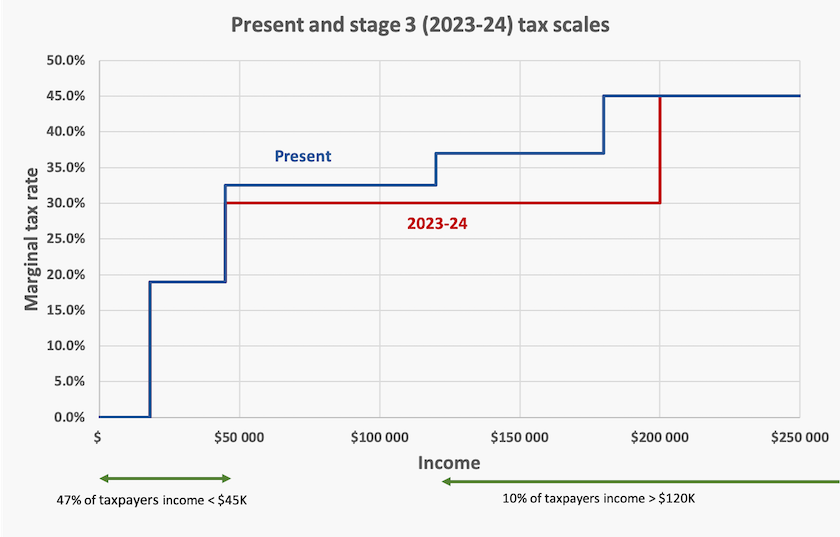
One hundred economists and tax experts have published an open letter to the prime minister, urging the government to reconsider the cuts, noting that they would contribute to further widening of income inequality and would cost public revenue more than $250 billion over the next ten years.
Who’s doing well – people in the transactional economy
Guess who’s doing well – who’s getting those $200K + salaries.
Educators, farmers, craftspeople, health care workers, engineers, and others in the real economy, providing goods and services that contribute to our wellbeing.
Just kidding.
The Aussiecorporate Salary Guide reveals who are enjoying the big salaries. They’re management consultants, auditors, tax planners, lawyers in big firms and investment advisors.
They’re all part of the transactional economy, an overhead borne by the rest of the economy. Almost all of them, particularly those with the highest salaries, are in the private sector.
In comparison with truly “developed” nations, Australia carries a disproportionately large transactional overhead. Successive governments, particularly the Keating and Howard governments, have been generously permissive to the transactional sector.
It could be worse
Visual Capitalist brings us a chart, drawn from data in the World Inequality Database, showing where people sit on the income scale for 16 countries and in the world as a whole.
That data shows that Australia has a comparatively tight spread of incomes. Around 10 percent of Australians have a pre-tax income of $US 4 000 or less, which is about the same percentage as in the US and Canada. At the other end of the scale only 1 percent of Australians have a pre-tax income of $US 150 000 or more, while in the US that 1 percent has an income of $US 350 000 or more.
That means for about two-thirds of Australians our income distribution is very similar to that of the US: the big differences between Australia and the US are among those in the top one-third. Note that these figures relate to pre-tax incomes; it’s a still moderately progressive tax system that protects us from America’s excesses. But that progressivity is under threat from the Stage 3 cuts.
Visual Capitalist’s chart is a sobering reminder that about 90 percent of the world’s population has an income below $US 40 000. That’s about $A 60 000.
Australians enjoy high intergenerational economic mobility
Nathan Deutscher, a researcher in the Treasury Department, has produced a short and data-rich paper on intergenerational income and education mobility in Australia.
In all countries, including Australia, people tend to occupy the same income position as their parents, but Deutscher’s research shows that Australia is one of the more mobile advanced countries, about on a par with Sweden, and much more mobile than the US. We are not tightly bound to occupy the same place on the economy ladder as our parents.
That’s probably because we are taking in many immigrants. Deutscher finds that second-generation immigrants tend to have much greater income and education mobility than native-born Australians. That’s particularly noticeable among children of Italian, Chinese and Vietnamese immigrants, but less so among English immigrants. Also Australians in Western Australia and Queensland, the mining states, tend to be more mobile than other Australians. Echoes of the gold rush?
The many dimensions of economic inequality
Most media reports on inequality are about disparities in income. Perhaps that’s because people are reminded of their income every fortnight from their pay packet or government benefit. Also, there is no shortage of statistical data on income.
Another important aspect of inequality is wealth.
Two articles in The Conversation draw our attention to inequities in wealth in Australia. Brendan Coates and Joey Moloney of the Grattan Institute write about the emergence of a “Jane Austen world”, where there is a division between those who own real estate and those who don’t. Tax incentives have helped create this inequity, but so too have inheritances, perpetuating a division between property-owning and property-poor classes: How housing made rich Australians 50% richer, leaving renters and the young behind. A similar analysis is provided by Rachel Ong VoforJ and Christopher Phelps of Curtin University, who write about the housing wealth gap between older and younger Australians.
The main point in these articles is the gap between owners and renters, who are at the mercy of landlords (a medieval term distinguishing housing from normal markets where customers have more equal power). The authors also refer to the high market value of houses, but that is something of a distraction, because the market value of a house may be quite detached from its value in terms of providing comfort. Economists, conditioned to think that all value can be expressed in financial terms, do not always understand the distinction between market value and real wealth. (See the next article on housing debt.)
Besides financial assets and housing there are many other less easily measured but important aspects of wealth – one’s health, safety, and the many dimensions of human capital including one’s social connections, education and skills. There are mutually-reinforcing inequities in all these aspects of wealth.
Martyn Goddard on his Policy Post explores several dimensions of economic inequality in Australia: Inequality and the neoliberal legacy, going beyond income into indicators of relative wealth. For example households in the highest income quintile have almost a quarter of a million dollars of saving, while those in the lowest quintile carry more than ten thousand dollars of net debt. He also goes into disparities in health, which correlate closely with disparities in financial well-being.
An extended period of widening income inequality, as we have experienced over the last 50 years, leads to an ever-widening and more enduring inequality in financial wealth. Australia stands out way ahead of most other “developed” countries for the growth in the proportion of population classified as “millionaires”.
On a different scale is the growing number of billionaires. In a media release Oxfam Australia notes that “Australian billionaire wealth is 61 percent higher than it was before the pandemic and there are 11 more billionaires today than there were in 2020”. This is in the context of a global Oxfam Report Survival of the richest: how we must tax the super-rich now to fight inequality. “Every billionaire is a policy failure” the authors write, noting that over the last thirty years there has been a growth in trillionaire wealth from around $1 trillion to $14 trillion (in real $US terms).
The growth ofn the super-rich, with assets in the tens, hundreds and thousands of millions of dollars, goes beyond the normal politics and economics of distribution. The super-rich are able to live beyond the reach of national governments, are able to fund election campaigns, are able to invest in traditional and emerging media, and are able to establish unassailable positions in markets with natural monopoly characteristics.
At least some of the super-rich understand that the present economic arrangements, that have allowed them to accumulate vast fortunes, is unsustainable. In his post Why millionaires want to pay more tax Crispin Hull reports on how 200 participants at the World Economic Forum at Davos, some of the world’s wealthiest, are pleading for higher taxes to be levied on themselves. Hull writes that they recognize:
… that their privileged comfortable positions depend upon a civil society. Their position depends upon governments being able to provide at least defence and police, but also health and education for the masses to ensure they do not rise up in revolt at rising inequality or engage in crime sprees and remain a stable employee and customer base.
That requires taxes, especially from those most able to afford them.
IMF warns Australia about household debt
Australians are living on debt, particularly debt to finance housing.
Our debt is high by our own historical standards, as shown in the graph below, drawn from RBA data.
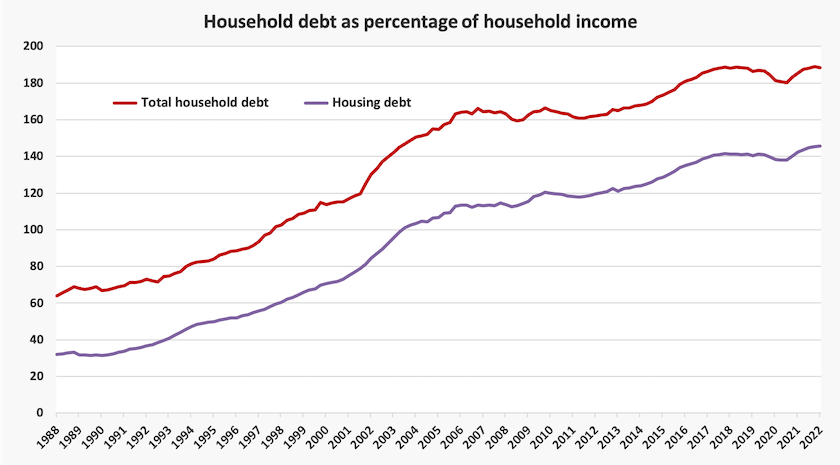
That rise in debt coincides with the long-term fall in interest rates that started around 1990, but that is not the only causal factor. Policy played a role. The 1999 changes to capital gains taxation were part of a policy by the Howard-Costello government to convert housing from an essential item in our lives, to a speculative financial asset. The intention was to use housing price inflation as a means to create an impression of rising wealth among the financially naïve. If the market value of our house rises by $100 000, we think we are $100 000 better off, and are more likely to attribute our good fortune to the government.
Just to give housing speculation a further nudge and to push up prices higher, shortly after the Morrison government was re-elected the Australian Prudential Regulation Authority relaxed the criteria by which lending institutions could assess borrowers’ capacity to repay loans.
Those policies worked, as first-home borrowers got into heavy debt, and as homeowners and speculators with “investment” properties basked in the illusion that because the market value of their houses had risen they had become better off. It’s an illusion because it’s only inflation: the real value of a house lies in provision of shelter, comfort and locational convenience, while the market value is mainly an outcome of a distorted and politicized financial system.
The illusion started to fall apart last year when the RBA belatedly set out to raise interest rates. Even if the RBA holds off raising rates next week there is an interest rate shock coming to borrowers whose fixed rate housing loans, taken out when interest rates were lower, reset to current rates. The housing bubble may finally be deflating.
To an extent household debt stress is a phenomenon in all “developed” countries, but Australia, along with New Zealand, has a very high burden of high household debt and unaffordable housing compared with other prosperous countries. The IMF notes the vulnerable situation of Australia and New Zealand in its report Housing Market Stability and Affordability in Asia- Pacific. On Pages 13 to 16 of that report are disturbing figures about Australia’s house prices. On households’ capacity to handle housing debt the IMF writes:
… as interest rates increase, affordability is declining rapidly, despite falling housing prices. In 2022, housing prices may be as much as 70 and 50 percent above what a median household can afford in New Zealand and Australia, respectively, and the average household would need to spend more than 40 percent of its disposable income to afford housing priced at the median.
By comparison other high-income Asian countries – Hong Kong, Japan, Korea and Singapore – have far less stress from housing debt.
Consumption on the never-never
Almost no matter what you buy online, you are offered the option to pay in interest-free instalments, typically involving four payments over a reasonably short period. Buy-now-pay-later schemes are the successor of the old “layby” schemes, but they differ because the consumer gets to take the goods home and, unlike layby, BNPL arrangements have not been adequately covered by existing consumer credit regulations. As with layby BNPL usually applies to small purchases, generally (but not always) less than $2000.
BNPL firms make their money from fees paid by those who default on payments, and in some cases from merchant fees, which are incurred by all customers.
After a period of consultation, during which many misgivings about BNPL were raised, Treasury has produced an options paper for regulating BNPL, canvassing the extent to which BNPL should be covered under the Credit Act.
BNPL firms were the darlings of the stock market for a while, but their fortunes have waned as interest rates have risen and as those who opted for BNPL are now having to repay their debts – some having trouble finding the cash, and many bothered by keeping track of small transactions. Mac Schwerin, writing in The Atlantic, suggests that The “Buy Now, Pay Later”’ bubble is about to burst. Was BNPL simply a transient phenomenon in a period when the economy was awash with too much money sloshing around?
Inflation and interest rates
On Tuesday week the Reserve Bank will decide whether or not to raise the cash rate further. Most economists believe that it will raise rates because on Wednesday the ABS announced that the consumer price index had risen by 7.8 percent in the year to December. This is a little above economists’ expectations.
In a period when prices are highly volatile it makes little sense to read too much into a twelve-month figure, as some journalists are doing. The RBA should be guided on what they expect inflation will be in the next few months, disregarding what it was in early 2022.
Quarterly CPI inflation was 1.9 percent (7.8 percent annualized), but “trimmed mean” inflation – a measure that excludes outliers – was 1.7 percent (7.0 percent annualized).
We can get some indication of short-term movement from the ABS monthly CPI data, also released on Wednesday last week. This series is less comprehensive than the quarterly CPI, but it does give some idea of short-term movements which may have boosted the quarterly figure. This shows the CPI was coming down in the three months to October, before rising steeply in November and December. This is shown on the graph below, which looks at one month’s rise (brown line) and the latest three months (red line) annualized.
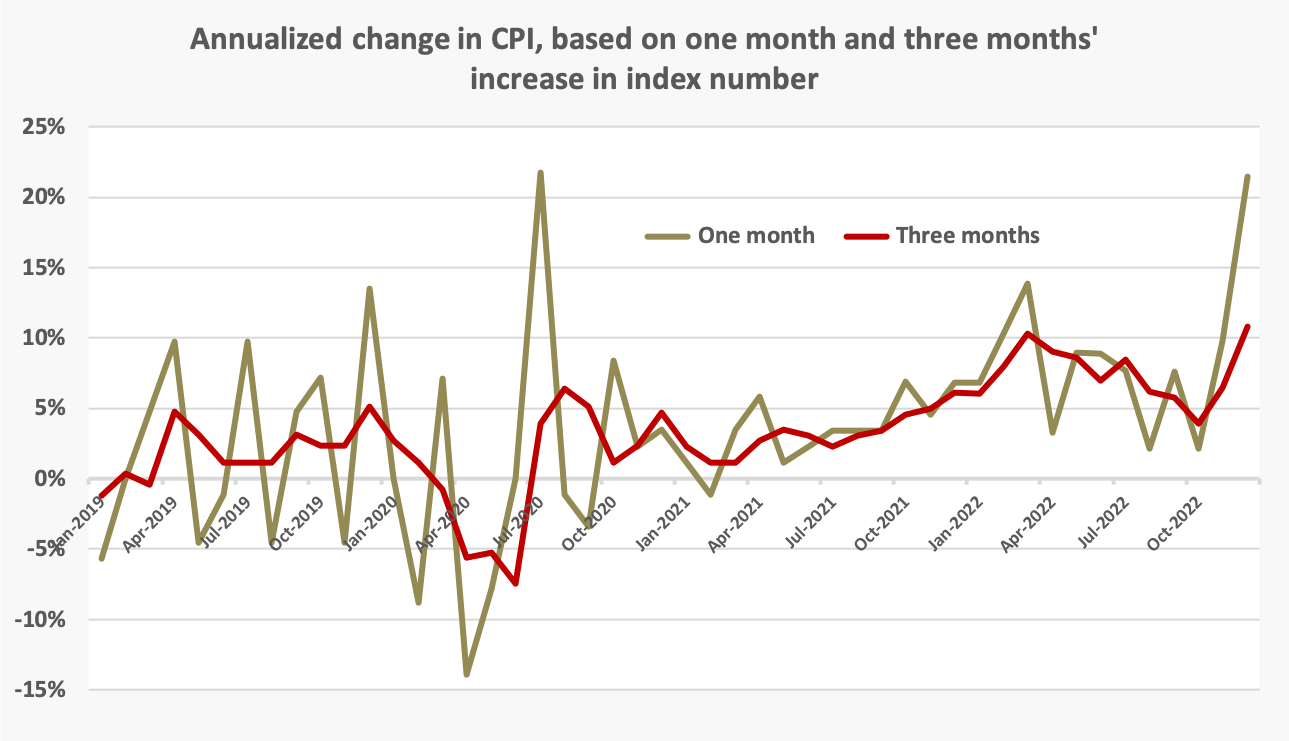
When we dig into the ABS website we see that prices of new houses and holiday travel stand out for their rise, but house construction costs may have peaked, and it is probable that the tourism sector has been benefiting from pent-up demand. These prices should soon start falling.
Population – growth is resuming, but at a more sedate pace

Our cities are still growing but the bush is catching up
Covid-19 hasn’t gone away, but its demographic shock in terms of a reversal of net migration is behind us.
The Commonwealth’s 2022 Population Statement has recent histories and projections of national and regional population for the next ten years (and longer for some series). Its summary chart is copied below.
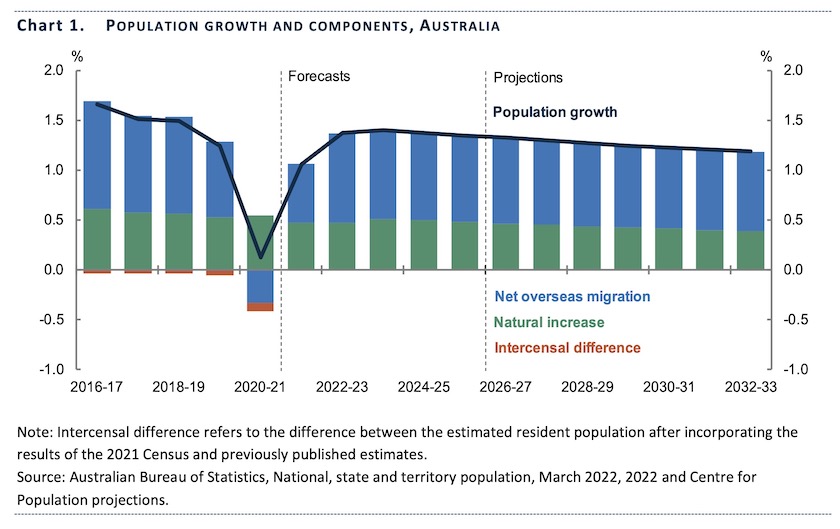
Note that while Australia is projected to still have a positive rate of population growth – unlike some other “developed” countries – both our rate of net migration and of natural increase will be lower than in recent years. Fertility – the number of babies per woman – after recovering from its low during the pandemic, is projected to resume its long-term fall. Under all migration scenarios our median age is projected to rise.
Victoria and Queensland are expected to be the fastest growing states over the next decade. Our capital cities will continue to grow faster than other regions, but that gap will narrow a little.
The government’s presentation of the Population Statement is factual and deadpan, but Crispin Hull notes that some media have seen it as a gloomy revelation of a “loss of 1.2 million people”, with implications for higher taxes in the future as our age-dependency rate rises. In his article Good and bad confused in ugly reportingHull demolishes that interpretation. In the same article he also demolishes the common media line that falling housing prices and rising private school fees are bad.
How Australia compares – pretty well, but the Nordic countries generally do better
Luxembourg has the unique classification as a “drive through” country. That is, if we’re driving through the area where France, Germany and Belgium meet up, we are likely to pass right through Luxembourg without noticing.

It’s also the OECD country with the highest per-capita GDP – $US131 000, double our pathetic $US64 000.
So if it's so well off, why aren’t we all seeking to live in Luxembourg? If we’re in the area why don’t we stop and have a look at the place?
The answer is fairly obvious: GDP is only one of a number of indicators of well-being, and a pretty poor one at that.
Martyn Goddard, on his Policy Post, has assembled 30 indicators of wellbeing – income, the gender pay gap, life expectancy, public spending – to name a few: How civilised? A scorecard of the 20 richest nations. On one of these indicators we come out on top (read his article to see which one), but for most of these indicators we are around the middle. For most indicators the Nordic countries come out on top. Goddard has collated the variables, and we rank #13, alongside Denmark – well above the USA and Britain, but one rank behind New Zealand.
On a related matter the Essential Report this week has a set of questions about how we feel in comparison with other countries. We’re displaying the requisite amount of national pride: 82 percent of us (particularly older people) believe it’s a better place to live in than in most other countries, and 77 percent of us are “proud of Australia”, but 47 percent of us (particularly Labor and Green voters) believe Australia needs to be a better global citizen.”
Telstra towers – another cost of ill-considered privatization

Each mobile phone tower is locked to one specific telecommunication provider. Victoria Pengilley of ABC Western Queensland draws our attention to this restriction, and passes on demands made by MPs in rural regions to free those towers so that other providers can use them: Federal MPs, advocates call for mandated roaming to improve mobile phone reception in the bush.
The zealots who broke up and privatized the old Telstra telecommunications monopoly in the 1990s seem to have been ignorant of engineering, geography and the basic economics of public goods and networks.
Such assets should be owned by a public monopoly, with access available to all competing carriers. That would ensure wider regional coverage, would avoid costs of duplication, and would allow a greater degree of competition. (Economists would identify the present situation as one incurring a high deadweight loss.)