The pandemic – it’s still with us
Worldwide
Worldwide, according to the WHO, the number of cases and deaths continued to fall last week – by around 20 percent compared with the previous week. But the reliability of case data and even of death data has fallen, even in “developed” countries.
From what data is available, the WHO reports that in western Europe, Korea, Australia and New Zealand there is still a high rate of new cases.[1] In general these are countries that took strong action against earlier strains, and are now close to having lifted most restrictions.
In a short interview on PBS Radio Anthony Fauci warns about the need for ongoing vigilance as the number of cases in the USA rises. Death and hospitalization rates are fortunately down, but there is waning immunity – both the immunity from vaccination and the immunity from prior exposure. Out of all “developed” countries the USA stands out as having a particularly low third-dose vaccination level, while in most other “developed” countries third-dose vaccination levels are 50 percent or higher. Singapore has the highest level of 73 percent.
China, for now, seems to have contained its outbreak. Last week recorded case numbers appear to have stabilized at about 30 000 a day, a trivial number for that country. Few epidemiologists believe its containment policy can be sustained, however, and China’s strict containment measures are already having an effect on business conditions, not only in China but also throughout the world. For example, the world’s largest container port, Shanghai, is closed. Nevertheless, China has no intention of backing down from its zero-Covid policy, as explained in a 10-minute CNBC explanatory video. There is a great deal of national pride influencing its Covid policy.
1. The WHO classifies rates above 300 per 100 000 per week in its highest category. That equates to 430 cases per million per day. Our daily case rate is around 1600 per million. ↩
Australia
Our rate of recorded infections is falling, as shown in the graph below.
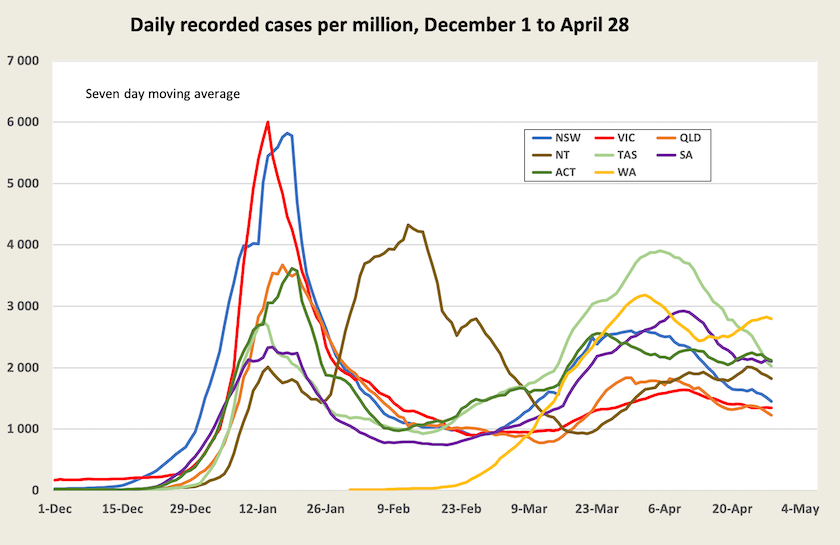
As with other countries’ data we should interpret our own case data carefully.
Between Easter and Anzac Day many states have had had school holidays, which means fewer cases would have been picked up among children. And as epidemiologist Nancy Baxter points out, in a message similar to Anthony Fauci’s, the case rate takes much longer to subside than it does to rise. Also, like Fauci, she repeats the warning that Covid-19 isn’t going away.
If we rely on recorded data, a quarter of Australians have been infected with Covid-19 since mid-December when the Omicron strain first arrived – 27 percent in New South Wales, 14 percent in Western Australia, with other states and territories in between. These are significant understatements for three reasons: there was a period when RAT tests were unavailable and PCR testing stations were overloaded; many people have had asymptomatic infections; and many others may not be bothering to report infections. In the USA, for example, according to Fauci’s estimates, based on checking a statistically significant proportion of the population for antigens, almost 60 percent of Americans have been infected with Covid-19, while only 24 percent are officially recorded as having been infected.
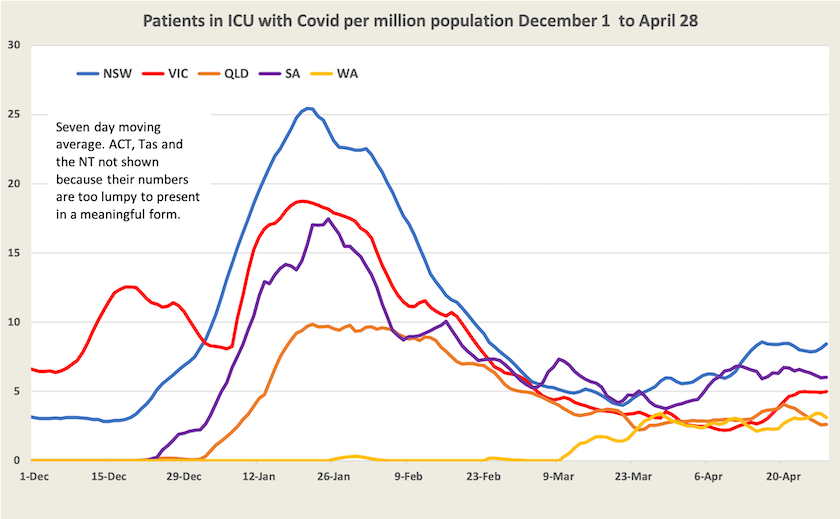
People in ICU and deaths
We are seeing some rise in the number of people in ICU with Covid-19, and some rise in deaths, both of which are indicators of the load on the health system.
Death data is a little lumpy because there are sometimes revisions where a large number is recorded or removed on one day, and because deaths may accumulate a few days before being recorded.
Presumably reflecting the surge in April, deaths have now risen from around 1.0 per million per day to 1.5 per million per day. That would equate nationally to abut 14 000 deaths a year. To get a feel for this number, on average around 160 000 Australians die each year.
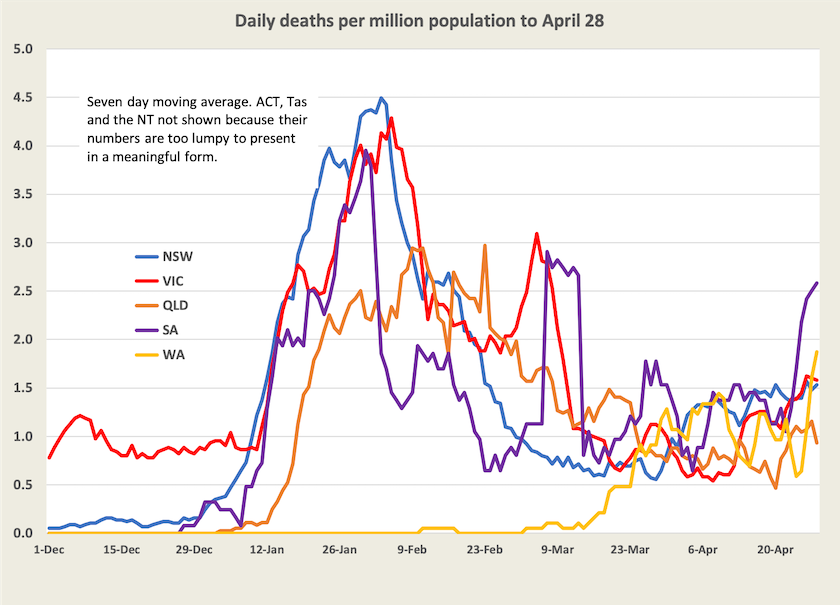
It’s still a serious disease, and, as with other viral infections, Covid-19 can have long-lasting consequences.
Some public health officials have noted that contrary to some people’s fearful expectations, Western Australia has so far coped reasonably well as it has cautiously opened up. Its death rate is now high, but so far it has escaped the surge other states experienced in January. A graph shows just how well Western Australia has done so far.
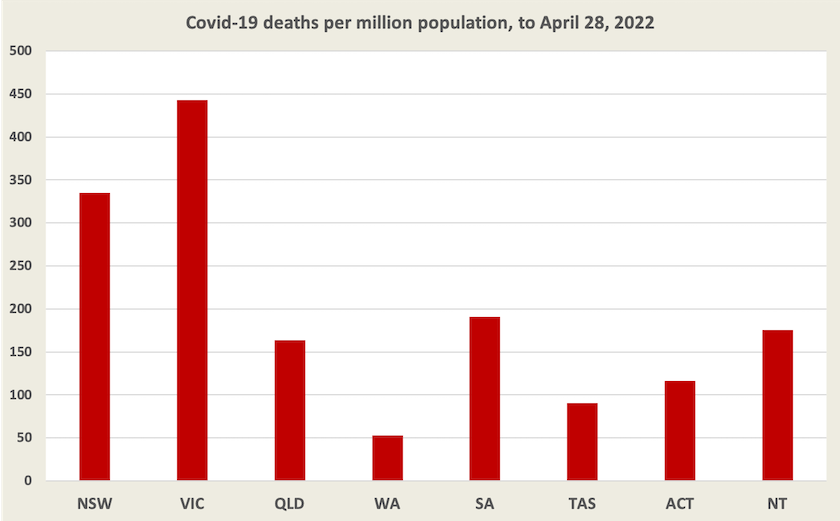
Many factors lie behind these state differences, but it is apparent that the states that had easier borders (and one which itself is girt by sea), had stronger public health measures and were more cautious about opening up, have done better that New South Wales and Victoria.
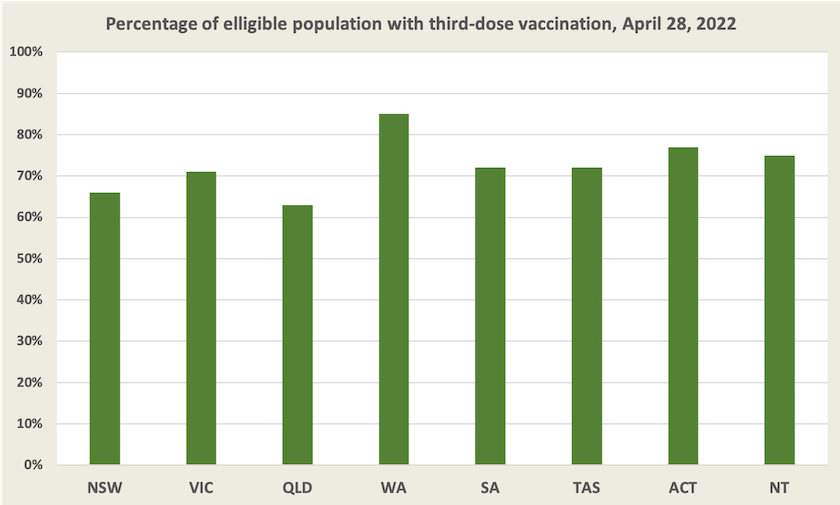
One factor that’s particularly relevant now is the level of third-dose vaccination. Western Australian public health officials attribute some of that state’s success to a high uptake of third-dose vaccination, which is indeed much higher than in other states. The graph below shows states’ third-dose vaccination rates: while there is not a great deal of difference in the heights of the bars, the important aspect of this graph is the gap between the bars and 100 percent. That’s about the people who are not vaccinated, who are loading hospitals and are dying.
With so many variables and with so much longer for the virus to run, it would be folly to attribute too much to cause and effect, or for state governments to assume bragging rights for their performance. We do, however, have a set of natural experiments in progress, which should provide rich research pickings for epidemiologists, and guidance for public policy if we elect a government that takes public health seriously.
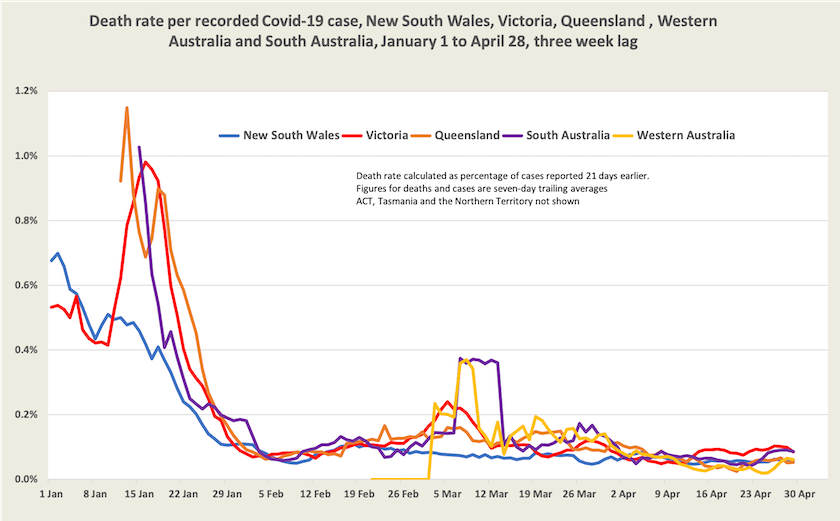
Death rates
Although more Australians are dying as a result of a surge in cases, the death rate per case remains at about 0.07 percent, or between 1.0 and 1.7 per thousand cases recorded.