The pandemic – still around, even though we wish it gone
World
For those countries that keep good records and report them to the WHO, it appears that in terms of killing people the virus is on the way out, while it’s still infecting just as many as in its earlier peaks.
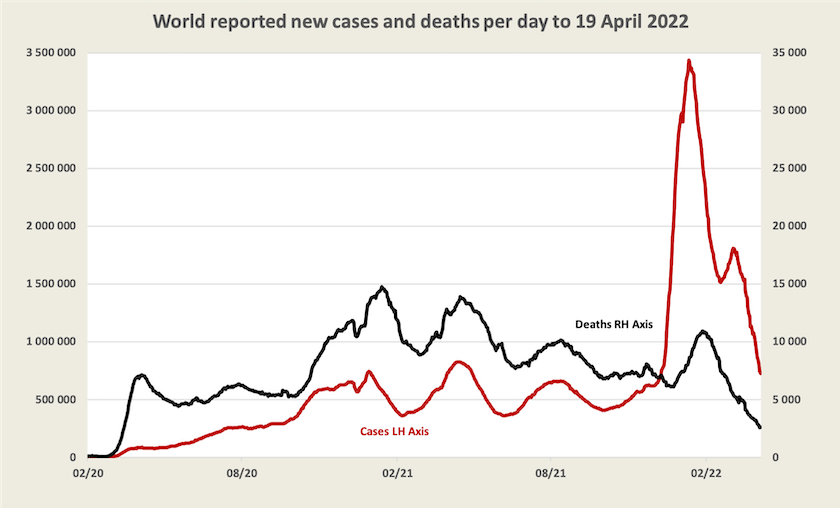
According to WHO data, some western European countries, Korea, New Zealand and Australia are the only countries where weekly reported cases now exceed 3000 per million. (Our weekly infection rate is around 12 000 per million).
It is beyond belief that the virus is more prevalent in a few “developed” countries with good health systems than in the rest of the world. For reasons explained in earlier roundups, WHO global data is becoming less reliable.
Even within “developed” countries data on cases is becoming less reliable, as countries relax reporting requirements, as asymptomatic cases go undetected, and as people just don’t bother reporting cases. Data on vaccination is likely to be more reliable than data on cases however, and provided there is not too much ambiguity about the causes of deaths, data on deaths should be fairly sound.
Based on this more-or-less reliable data a scatter diagram of three-dose vaccination and daily deaths per million is shown below. (This is an update of a similar chart occasionally included in roundups.)
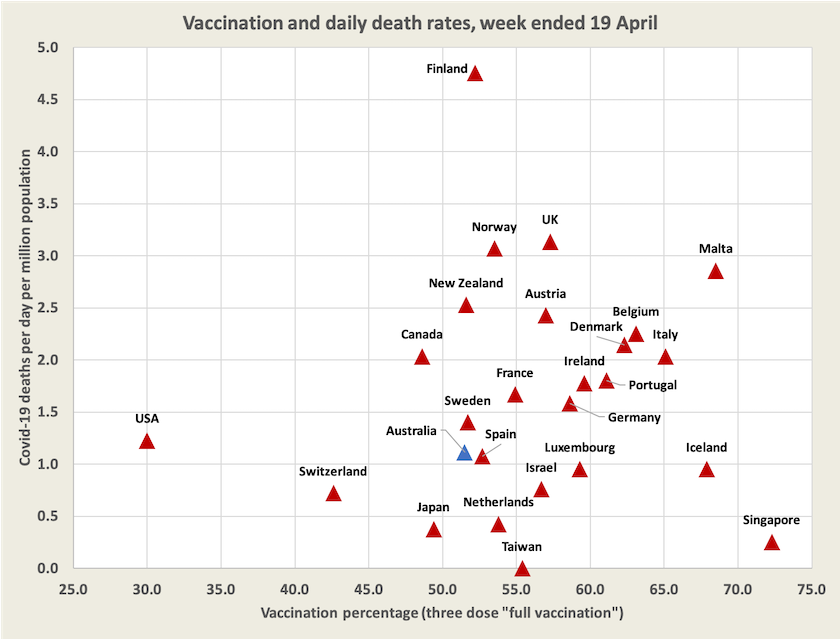
Not shown on this diagram is China, the only significant country still pursuing a zero-Covid policy. China is reporting about 30 000 cases a day, still tiny in relation to its population. Its growth rate has slowed, but it’s still on an exponential path, doubling every 16 days rather than every 8 days earlier in April.
Australia
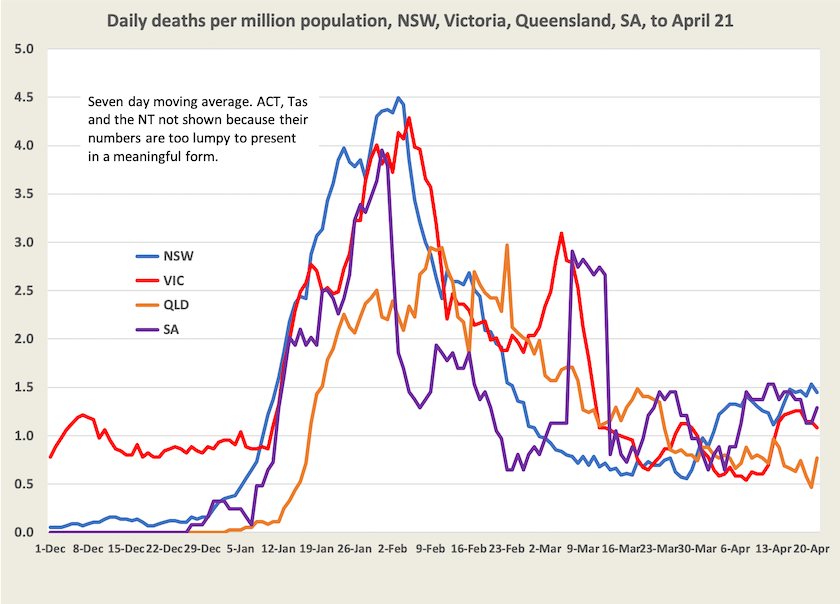
At around 1.0 daily death per million population Australia is among countries with a low death rate, even though our vaccination level is low compared with that of other developed countries. (See the scatter diagram in the previous section.)
Although the public and policymakers have become somewhat nonchalant about Covid-19, that is still a high number of deaths. It’s about the same number in relation to the population as road deaths were when they reached their peak fifty years ago. Another way to consider the number of Covid deaths is that at present rates it is around 9 000 a year, against a normal background of 150 000 deaths a year. In addition a significant proportion of people who catch Covid-19 suffer the debilitating effects of chronic fatigue, a common consequence of severe viral infections.
Around Easter there were newspaper reports of cases falling sharply, but there is a distinct pattern for recorded cases to be lower on weekends before bouncing back during the work week, possibly reflecting the fact that many cases are recorded on schooldays. Recorded cases have peaked in those states where this strain got its earliest foothold, but the decline is small, and there is the possibility that a smaller proportion of cases is being reported.
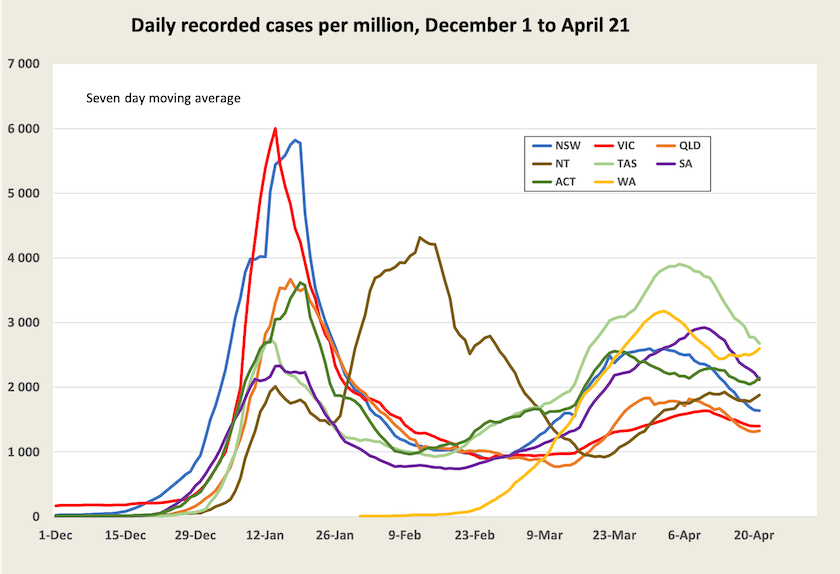
Data recorded by the New South Wales Health Department shows that the number of cases among people aged under 50 has been falling the over the last few weeks, but has been rising among older people.
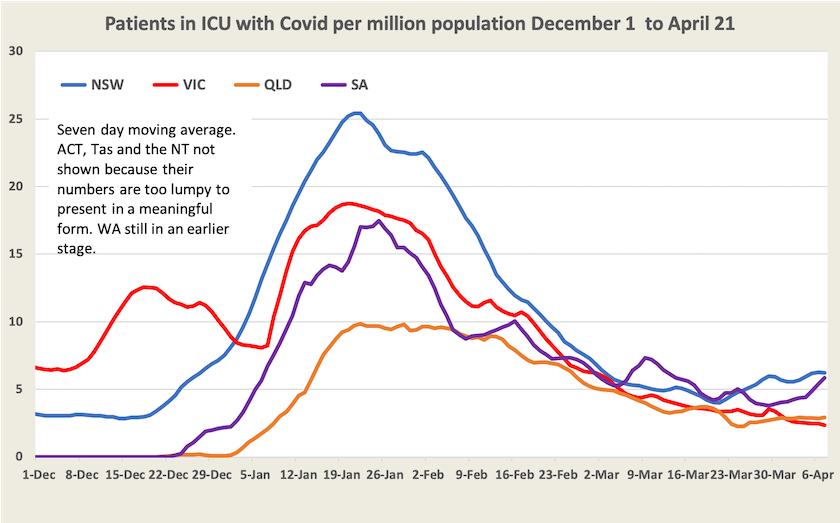
An indicator of the severity of cases, and therefore the load on hospitals, is the number of cases in ICU (the number of people with Covid-19 in ICU at any time, not the number being admitted to ICU). That is rising a little in New South Wales and South Australia. In view of the slowing rate of vaccination (we were quick to take up first and second doses, but are sluggish on third dose vaccination), cases of severe illness requiring hospitalisation could rise.
The number of deaths is still hovering around 1.0 per day per million. There’s a lot of noise in death figures because they are not always recorded on the actual day of death. They do seem to be rising a little, possibly reflecting the peak in cases earlier this month.
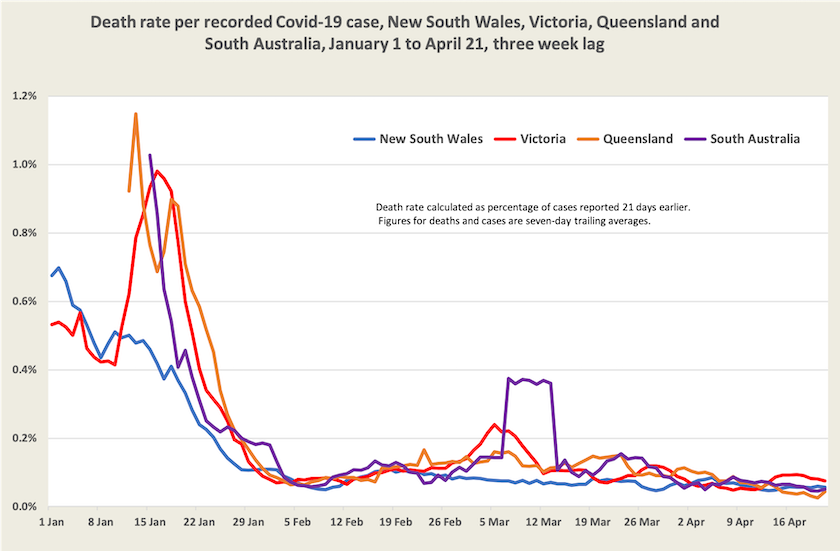
The death rate per case, an indicator of personal risk, continues to fall. It is around 0.06 percent, or one in 1700 cases. That’s across all ages and all vaccination levels. It’s higher among the unvaccinated and among older age groups.
Three developments may drive another surge in cases.
One is the relaxation of quarantine requirements for close contacts in most states.
Another is the greater infectiousness of a new recombinant version of the existing Omicron strains. On the other hand, provided most people who catch the Omicron variant gain some degree of immunity, people may be enjoying some level of natural protection. According to official records, so far only 26 percent of people in New South Wales have been infected in the Omicron wave. (That’s the highest of all states.) But according to Norman Swan and other epidemiologists, recorded cases are understated by a large factor – possibly as high as 5. If that factor is 4, by now more than 100 percent of people in New South Wales have been infected in this wave. The reality is that in the absence of thorough and expensive research involving tests to see who has been infected, we don’t know how this wave is travelling: it may be only one-quarter of its way along its path of infection, or it may be finding it a little harder to find new people to infect.
The third factor is the onset of colder weather, which, in southern states, is likely to see more people gathering indoors in poorly-ventilated spaces. But on the other hand fourth-dose vaccinations are starting to kick in.
All of this indicates continued uncertainty for those making personal and business plans, with the consequence of ongoing economic disruptions and possible surges in demand for already-stretched health care systems.