The pandemic
World deaths falling, Omicron taking off in China
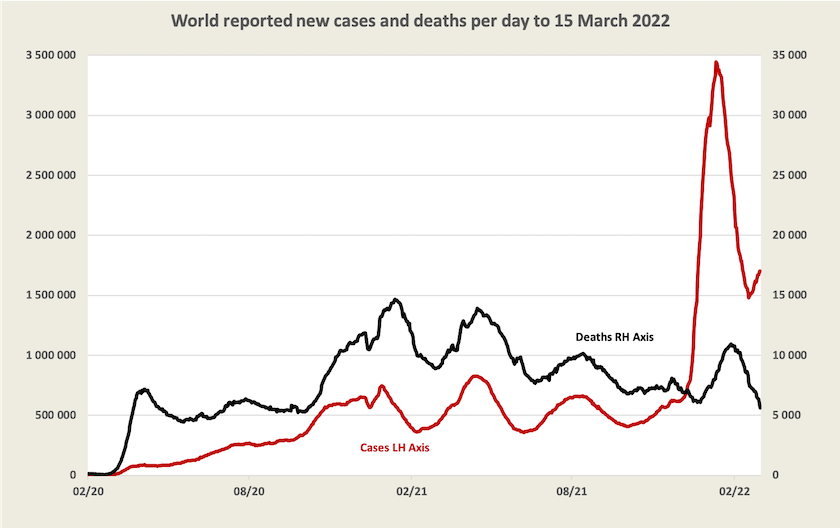
In those countries where records are kept, cases are once again rising while deaths are falling – to the lowest daily rate for 18 months.[1] This second surge, and lower rate of deaths, is consistent with the behaviour of the Omicron “sister” strain, which is more infectious but no more deadly than its sibling.
The most significant development, however, is as yet too small to show up on any graph. There have been outbreaks of Omicron in China. China’s reported daily cases since February 5 are shown in the graph below.
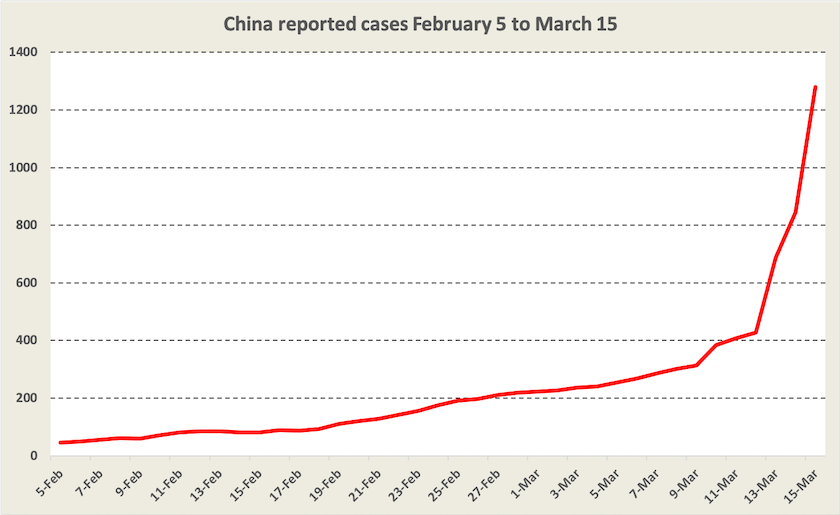
Now 1200 cases a day – about the same number of cases as are reported in Tasmania – is a trivial number in a country of 1.4 billion. But Chinese officials are right to be concerned, because cases are growing exponentially, doubling every 10 days.[2] If that trend is continued, the whole country could be infected within 6 months. Through tough lockdowns it is attempting to sustain its Australia-New Zealand style local eradication policy, but it’s hard to see how that is possible with the present variant.
Fortunately China, like other advanced countries, has a high level of vaccination – 91 percent of its population has had two doses of vaccination, and 40 percent have had an additional dose.
Nevertheless, as has happened in Australia, this wave is likely to be disruptive, and to put a load on the country’s health systems. In view of China’s central position in global manufacturing supply, the world can expect more supply chain problems unless, as is unlikely, China does manage to suppress this outbreak.
Hong Kong, which keeps separate data, has a much higher rate of infection than mainland China – about 33 000 cases a day in a population about the same as New South Wales. As Norman Swan points out on Coronacast, Hong Kong has a low level of vaccination among older, vulnerable people, and it has a high death rate. Hong Kong’s experience reminds us that the Omicron variant is still a deadly virus.
Vaccination
The WHO hopes to see 70 percent of the world population protected with two doses of vaccine by the middle of this year. So far only 58 percent of the world population has been vaccinated. North and South America, Asia and Europe have met, or are close to meeting, the WHO target, but levels of vaccination remain very low in Africa and the Middle East. Not only is there unequal access to vaccination, but there is also unequal access to antivirals and other treatments. Writing in The Conversation Deborah Gleeson and Brigitte Tenni point out that two years into the pandemic, unequal access to COVID-19 treatments threatens the global recovery.
The path from here
Among experts there are two strains of thought. One is that there should be much more effort put into vaccines. A fourth dose of existing mRNA vaccines certainly seems to restore waning immunity among those who had a third dose some months ago, and to restore significant protection against symptomatic disease. Pfizer-BioNTech is pressing for people over 65 to be given a fourth dose of vaccine. Pfizer also has an Omicron-specific vaccine in development, but early data from pre-clinical trials of Omicron-specific vaccines suggest that such vaccines may not be better than existing general vaccines.
A different view is provided by the UK’s John Campbell who, citing well-regarded studies, points to the high level of natural immunity against future infection among those who have been infected with Omicron. (22 minutes) Nick Coatsworth, our former deputy chief medical officer, says that Pfizer should stop talking about more doses of Covid-19 vaccine, and instead turn its ample resources into dealing with a vaccine for pneumococcal disease, an illness that kills more than 300 000 children a year. (Are they overlooking the as yet only partially-understood long-term effects of Covid-19?)
1. Even if deaths are reasonably accurately recorded (in some countries deaths are fudged for political reasons) case numbers are generally understated because of under-reporting, under-testing and the presence of asymptomatic cases. ↩
2. An exponential curve fitted on this graph shows a exponential function of y = 42.003 e0.683x, where x is the number of days since February 5. The coefficient of correlation, R, is 0.982. That curve is over the whole 39-day period: it’s probably an understatement, because the rate of growth has been above the exponential trend for the last few days. If even the trend over 39 days is continued, the whole country could be infected within 6 months. ↩
Australia
Infections
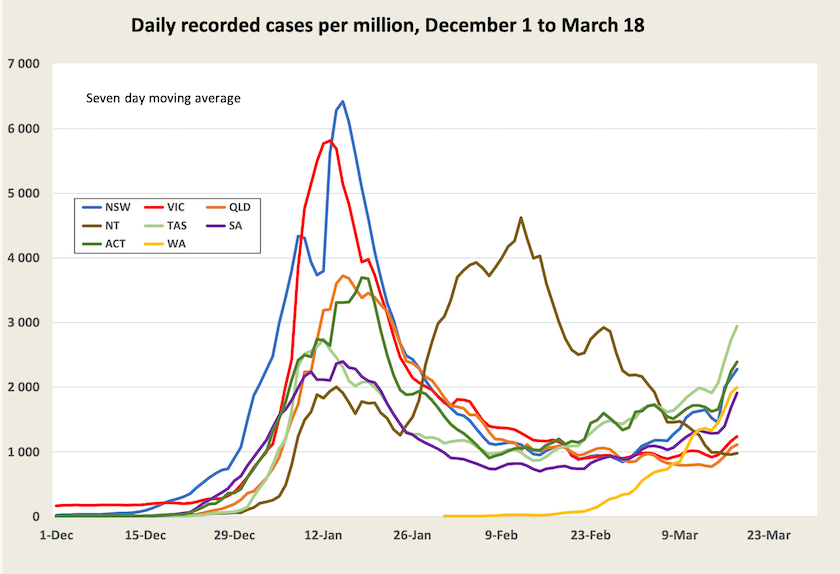
Recorded infection rates are once more rising as shown in the graph below. Some observers attribute this to the relaxation of restrictions, or to specific mass events, but such events tend to be state-specific and would show up as spikes. Because all states are moving in the same direction and at about the same speed, a more likely explanation is that we are seeing the effects of the BA2 sub-variant.
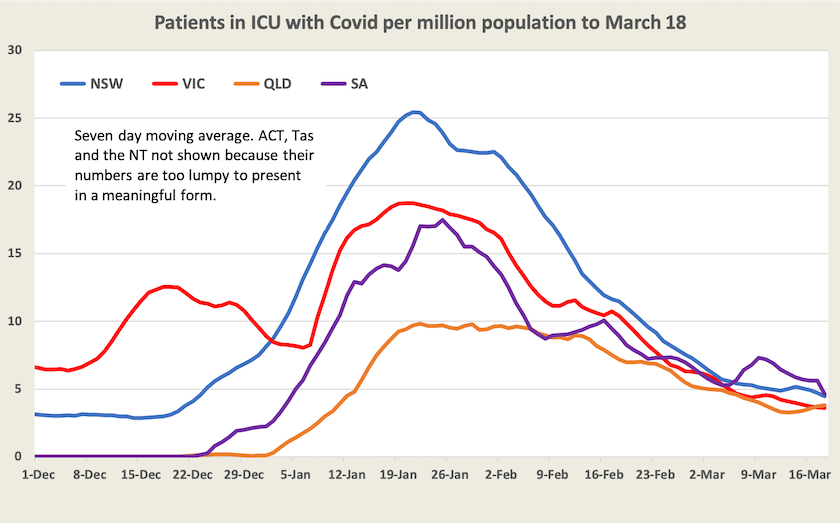
ICU cases
The number of people in ICU with Covid-19 (not the number being admitted to ICU) continues to fall, but it could start rising again – possibly in the coming two weeks, with a lag after infections rose in early March.
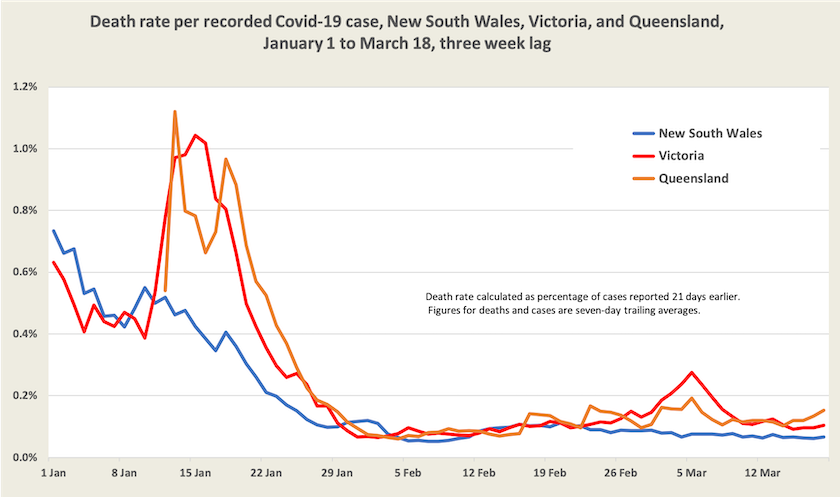
Deaths
Deaths too have been falling. Even with smoothing through use of moving averages, the figures are somewhat lumpy. Deaths may rise in the coming few weeks.
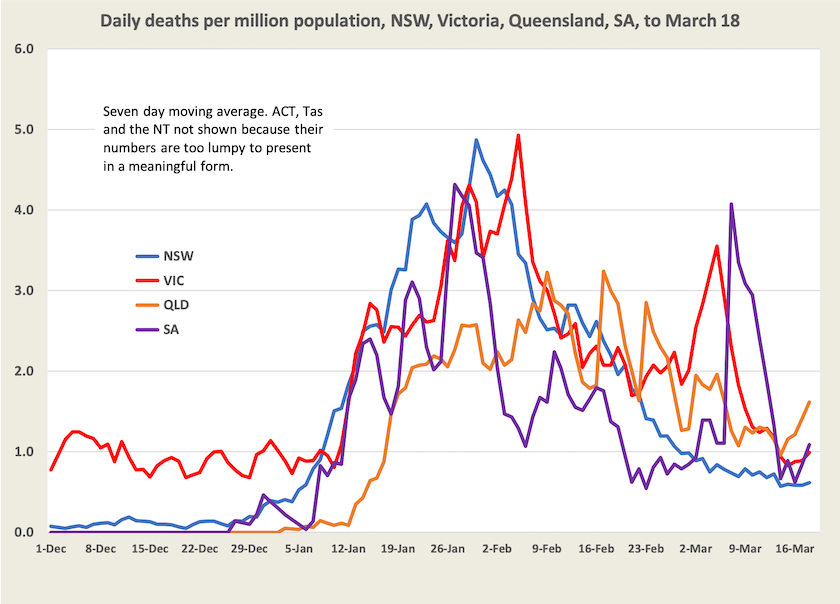
The death rate per recorded case remains low at about 1 per 1500 cases in New South Wales, 1 in 1000 in Victoria, and 1 in 700 in Queensland. This is not to suggest that moving from Coolangatta to Tweed Heads will give you more protection against Covid-19. Death rates reflect differing vaccination levels, different age structures, and, most important, different efforts in reporting cases. If people in Queensland are less diligent in reporting cases than people in New South Wales, their death rate will appear to be higher.