The pandemic
World
The most notable development in the last week has been a small uptick in recorded new infections.[1]
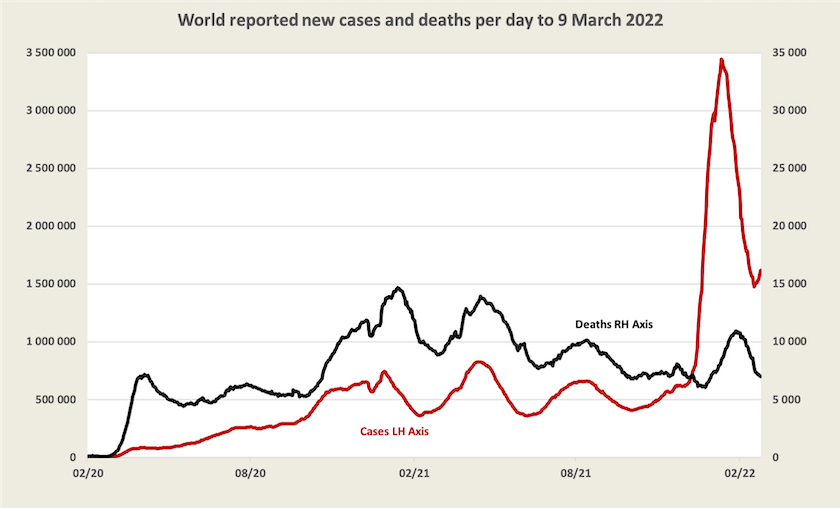
The WHO weekly epidemiological update, prepared a few days earlier, does not pick up this very recent rise. It is possibly attributed to a steep rise in the number of cases in what the WHO calls the “Western Pacific”, including Korea, Vietnam, and Japan: cases having risen significantly in all three countries. Most recorded cases are still occurring in Europe.
A short article on the ABC website – Global COVID-19 death toll passes 6 million, with rates highest among the unvaccinated – summarises the world situation, pointing out that the actual number of deaths could be four times the number of deaths recorded and reported to the WHO.
Although in the US the daily death rate is coming down, world attention will once again be drawn to its situation as its number of deaths reaches one million, which should occur sometime in April. Writing in The Atlantic – How did the many deaths become normal? – Ed Yong notes that a strategy focussed on making vaccines available, supported by only weak public health measures, has not worked.
1. Even if deaths are reasonably accurately recorded (in some countries deaths are fudged for political reasons) case numbers are generally understated because of under-reporting, under-testing and the presence of asymptomatic cases.↩
Australia
Cases and vaccination
There has been a great deal of publicity given to the emergence in of the Omicron BA.2 sub-variant. According to New South Wales data, about a third of cases detected in the last two weeks of February have been of this more infectious, but apparently no less deadly, sub-variant. Health authorities have been warning that cases will rise, but cases have already been rising, as shown in the graph below. Note that Western Australia has truly caught up, and it will probably have a late surge as occurred in the Northern Territory.
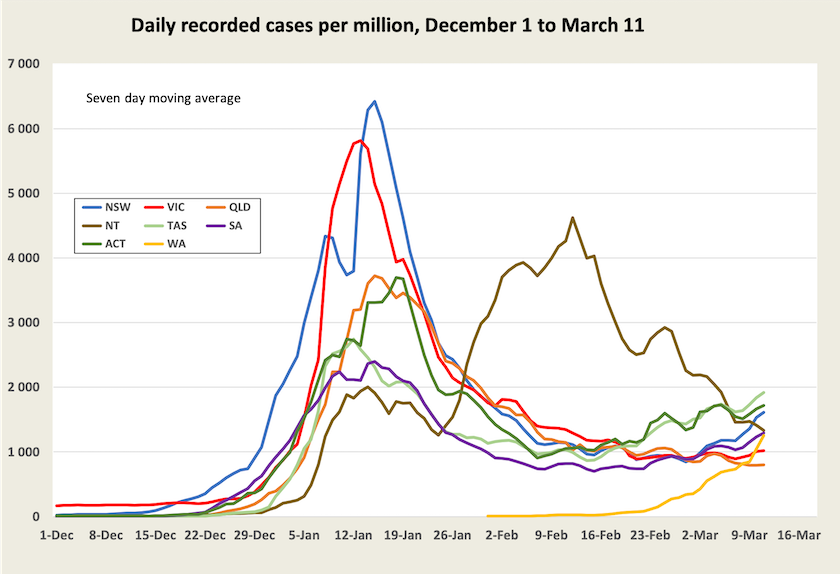
In view of the emergence of the BA.2 sub-variant, State authorities have been urging people to go and get their third shots. Nationally, only 47 percent of people have had a third shot (58 percent of adults). The ACT has the highest third-dose cover – 57 percent, and Queensland and the Northern Territory the lowest – 40 percent.
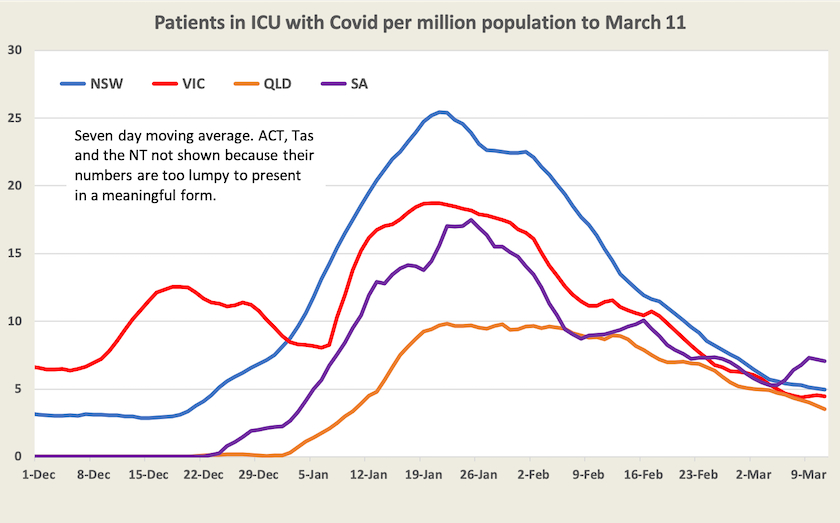
Patients in ICU
There is a definite fall in the number of people in ICU.[2] South Australia shows an increase, but the absolute numbers in South Australia are small.
Deaths
Deaths are falling. In spite of smoothing, the data is still lumpy. It is possible that in some states, authorities lump a number of days’ deaths together.
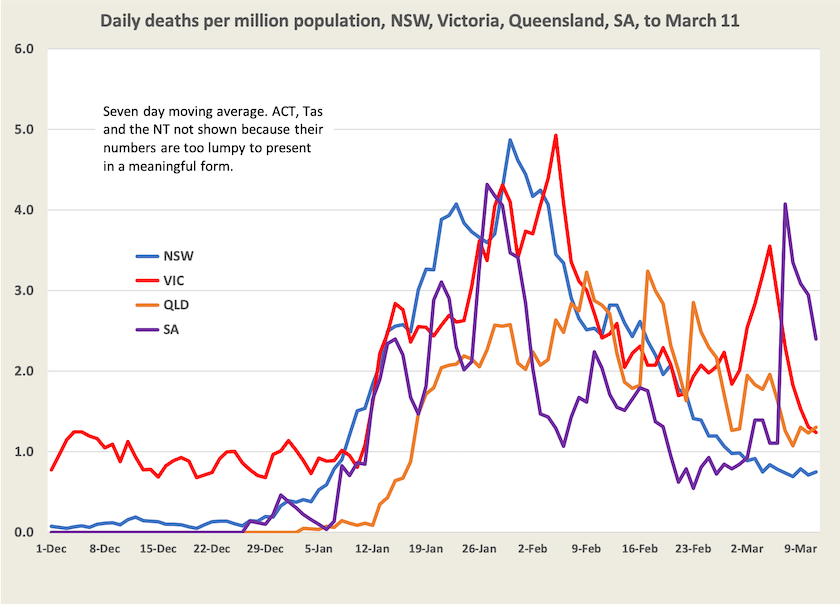
This same lumpiness is revealed in Victorian figures for death rates per case, shown in the next graph.
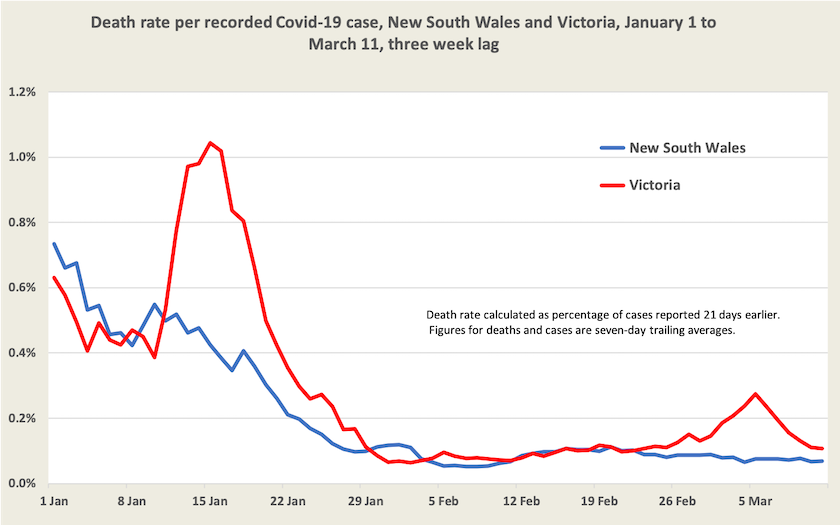
The death rate per case in New South Wales has come down to a consistent 0.07 percent, or about 1 in 1400.
Because the Omicron wave has been less deadly than previous waves, there has been a tendency to downplay its consequences. But because of the sheer number of cases it has resulted in a large number of deaths. Up to August last year, Australia had experienced only 1006 deaths from Covid-19. In the next four months, to the end of December, there were another 1247 deaths. Almost all of these would have been from the Delta variant, and many would have been avoided had the New South Wales government been more cautious about “opening up”.
This year, as Omicron spread, there have been another 3267 deaths: 1572 deaths in January, 1385 in February, and 310 in the first 11 days of March.
A focus on personal risk, which is low, tends to distract our attention to the load on the hospital system. In Australia there are about 440 deaths a day, or 17 per million people. Not all of these would have been preceded by a period of hospitalization, and even fewer would have been preceded by a period of intensive care. Very few would have required the care necessitated by Covid-19’s infectiousness. At Covid’s peak there were 4 extra deaths a day per million, a significant load on the health system, and even if it comes down to I death a day per million, that’s still a heavy ongoing load.
2. In ICU, not being admitted to ICU. ↩