Economics
Grattan’s Orange Book for an incoming government
In a quaint tradition, before elections public servants prepare briefs for the next government – a “red book” for Labor and a “blue book” for the Coalition, even though in a parliamentary democracy public policy is more complex than a binary red-blue division.
Without anticipating which party will claim victory, the Grattan Institute has produced its Orange book 2022: policy priorities for the federal government, that “maps out a policy blueprint to reignite wages growth and boost Australians’ living standards”.
It covers almost the entire gamut of public policy – anything that could be called “economic”, including health, housing, immigration, aged care, school education and, most importantly, the way we deal with climate change. Some policy proposals are highly specific, such as emission standards for vehicles, while others are more about the principles such as mechanisms to evaluate public expenditure. The whole set of proposals is encased in recommendations for taxation reform (mainly existing proposals languishing in the government’s “too hard” basket), reform of budgetary and fiscal processes, and stronger integrity measures.
It’s a package to be considered in its entirety. Aspects could be considered as unacceptable to the “left”, or to the “right”, but it is held together by a straightforward economic framework, allocating to the public sector what government does best, and to the private sector what the market does best.
You can hear the Grattan Institute’s policy experts describe its main aspects in a 37-minute podcast.
A glimmer of good news on house prices
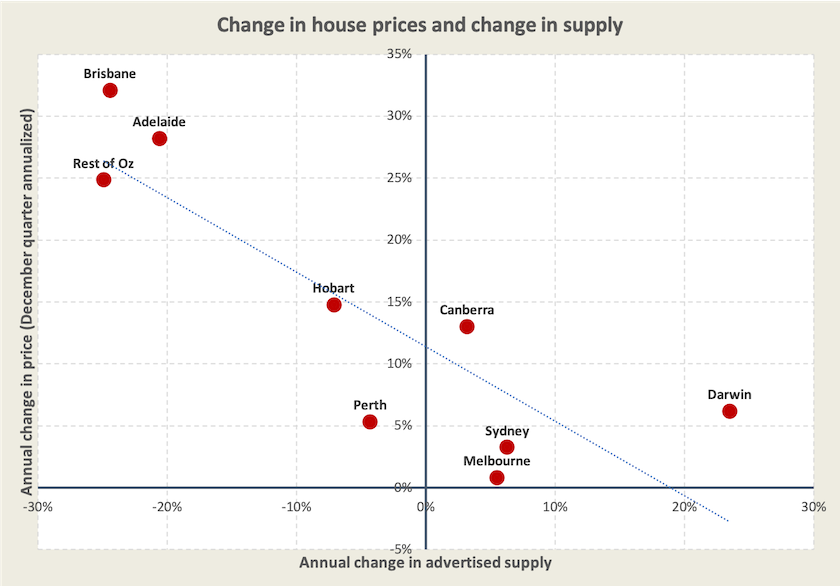
CoreLogic’s February home value index shows a slowing in the rate of increase in housing prices. There has been media attention to its finding that in February prices didn’t move in Melbourne and fell by 0.1 percent in Sydney. (Will that be enough to bring home some reality to over-geared “investors”?) Prices in Brisbane and Adelaide, and in non-capital-city Australia (which CoreLogic calls “regional”) are still rising rapidly.
CoreLogic provides data not only on monthly and quarterly price movements, but also on supply as indicated by the number of listings. The scatter diagram below shows annualized price movement plotted against changes in advertised supply.[1] Every Economics 1 lecturer would be thrilled to see that just occasionally supply curves can be discovered in the real world, outside the captivity of the lecture room. CoreLogic’s data confirms that there is a supply issue in housing – where supply is tight, prices keep on rising. That does not rule out the influence of demand-induced price rises resulting from tax breaks for “investors” and first home grants.
The next ABS report on residential property price indexes will be released on March 15. Because the ABS has separate series on detached housing and apartments it should confirm or negate the proposition that there has been overbuilding.
1. The annualized price figures are based on the December quarter movement ((1 + Dec movement)^4). This differs from figures in the CoreLogic table which shows the actual rise over 2021.↩
National accounts: the economy is roaring back to life, but not for everybody
The short story of the December Quarter National Accounts, released on Wednesday, is that the economy is roaring back to life, with 3.4 percent growth over the quarter and 4.2 percent over 12 months.
It is hardly surprising that a quarter of “negative growth” (minus 1.9 percent in the September quarter) should be followed by a quarter of strong growth, which more or less puts us back on track of mediocre economic growth, constrained by an economic structure in which productivity has been falling for many years.
People are spending their pent-up savings: just in one quarter income in the “accommodation and food services sector” rose by a whopping 26 percent. This is a seasonally-adjusted figure, meaning that it’s above the normal Christmas surge. As Australians spent, savings went down. The household saving ratio fell from 20 percent to 14 percent.
The biggest boost in final demand was in New South Wales, followed by the other jurisdictions – Victoria and the ACT – that had been dragged along with New South Wales to open up early as the Delta variant of the virus spread. Other states and territories, that were able to follow the advice of public health experts and maintain strong public health controls, experienced no growth in demand in the December quarter. Over a longer period however, incorporating the first year of the pandemic, the states that locked down to eliminate the virus locally did better than New South Wales.
One revelation in the national accounts is the early rise, and subsequent falls, in social security payments, shown in the graph below.
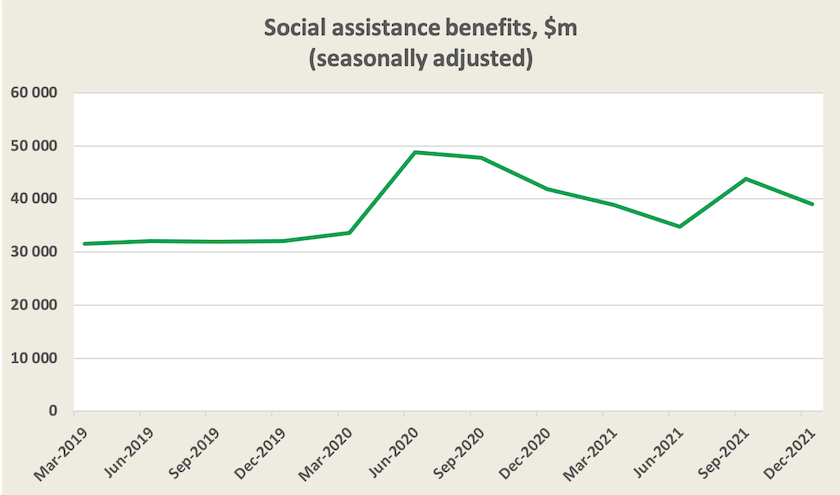
The early rise is explained partly by the rise in unemployment as the virus took hold, and largely by the temporary boost to the rate of unemployment benefits (“jobseeker”). The subsequent smaller rise corresponds to the spread of the Delta variant of the virus, during which time the rate of unemployment benefits was back to its earlier and stingy level.
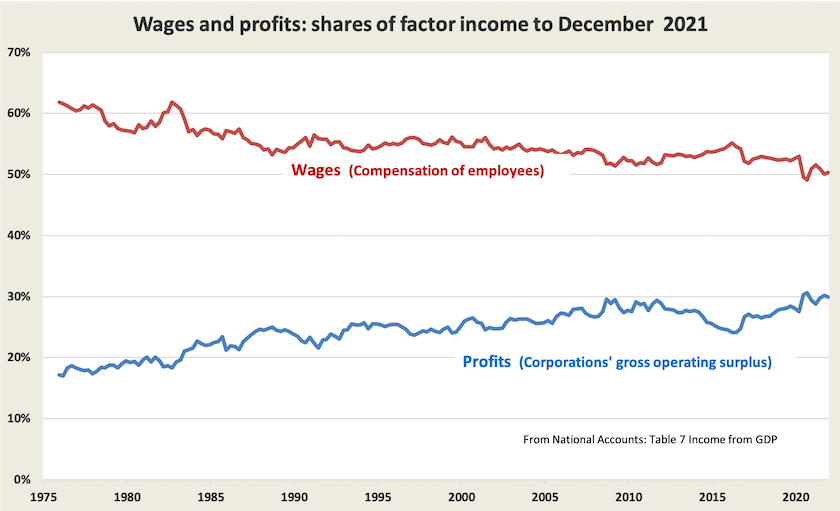
Another revelation on the national accounts is that over the last year, while total wages paid (“compensation of employees”) have risen by 5.3 percent, corporate profits (“corporations’ gross operating surplus”) have risen by 8.4 percent. There is no letup in the long-term trend for the share of wages and profits to move from wages to profits, shown in the graph below.
Wages and inflation: The Reserve Bank’s and others’ views
No one seriously expected the Reserve Bank to raise interest rates on March 1, and it didn’t.
In its statement accompanying its decision to hold rates, the Reserve Bank said unemployment should remain below 4 per cent later in the year and below 4 percent next year. Wages growth will be slow, and inflation will pick up, but some of the increase in CPI inflation will be as a result of high gasoline prices, rather than excess demand.
The big unknown is not whether there is inflation, but whether it is a once-off event associated with supply shortages in the pandemic and energy price-shocks consequent on Russia’s warmongering, or whether it is set in. Maybe workers are seeking seek higher wages to take advantage of their improving market position, and maybe there has been a shift in people’s income-leisure preferences: i.e. work is losing its attraction. A speech by Silvana Tenreyo of the Bank of England – The economy and policy trade-offs – presents the former view, and a National Bureau of Economic Research paper – The unemployment-inflation trade-off revisited: the Phillips curve in COVID Times – presents the latter view. (Neither is an easy read.)
Writing in Eureka Street David James of Personal Super Investor reminds us of the distributional consequences when central banks, in their quest to control inflation, raise interest rates: After drawing attention to the high level of household debt and the rise in asset prices during our extended period of low interest rates, he concludes that “any increase in rates will put severe pressure on anyone with high levels of debt. Instead of having a society of the asset rich and the asset poor, we may well end up with a society of the heavily indebted and the debt free”.
The cost of cronyism
In the January 29 Roundup I had a link showing Transparency International’s corruption perceptions index for Australia over the last eight years – a period covering the Coalition’s present term of office – revealing how Australia has slid down the international ranking, becoming more corrupt.
Writing in The Conversation – Perceptions of corruption are growing in Australia, and it’s costing the economy– Tony Ward of the University of Melbourne, shows that such a slide is meaningful. Corruption isn’t something that all governments do, without consequences, as a recently departed New South Wales premier suggested. It has broader economic consequences. With a little straightforward mathematics, Ward suggests that our 12-point slide on the Transparency index is costing us 0.6 percent of annual per-capita economic growth. When we are struggling to achieve any level of per-capita economic growth above about 1.0 percent that’s significant, particularly when one considers the compounding effect over an extended period:
Gambling – from SP bookies to high rollers’ casinos

Crown Dämmerung
Gambling has once again been in the news because of Austrac action accusing Crown Resorts Melbourne and Perth casinos of 547 breaches of anti-money-laundering and counter-terrorism finance laws – offences which, if proven, could incur fines up to $12 billion.
Writing in Eureka Street Frank Hurley provides an account of how gambling has changed over the last 70 years: Betting on the future of Australia’s gambling addiction. In times past there were the races, and there was plenty of small-scale illegal gambling, typically the SP bookie in the local pub. Legalized “non-sport” mechanical gambling started in New South Wales in the 1950s and soon spread to other states, with its accompanying dependencies – addicted gamblers and cash-strapped state governments. He describes how, from little things, big and nasty things have grown.
Citing Productivity Commission figures, showing how poker machine gambling has its worst effects on the poor, Hurley points out the harm inflicted by our under-regulated and over-protected gambling industry. He contrasts the conflict between moral principles and libertarian principles regarding gambling regulation, describing the policy issues in utilitarian cost-benefit terms.
He accepts as a “benefit” the fact that pokie venues and casinos provide jobs, but should we uncritically always count a job as a benefit? If the only way we can distribute activity and income is to have people working to help people gamble themselves into poverty, there is surely something wrong with our economic structure.