The vaccine's progress
Australia
Fifteen million Australians, or fifty-six per cent of our population, are unvaccinated. Eight million of them live in New South Wales, Victoria and the ACT, where the virus is spreading but is kept under control by strong lockdowns and other public health measures. The other seven million unvaccinated Australians live in smaller states that have so far quarantined themselves from the virus and where vaccination rates are lower than the national average.
If all our public health and safety measures were to be relaxed tomorrow, and if border controls were to be eliminated, it would be equivalent to letting the virus loose on an unvaccinated country just a little smaller than the Netherlands.
Of course there is no proposal for an immediate opening up, but the Commonwealth, business lobbies and some state politicians have raised expectations about the wonderful freedoms we will enjoy before Christmas, particularly with their repeated use of those “70 per cent” and “80 per cent” targets, neglecting the fact that these percentages refer only to the population aged 16 or more. Australians aged 12 to 15 are catching up, but as yet there is no vaccination for the 4 million Australians aged under 12. They may not be at great risk of death or other adverse consequences of infection, but as any parent knows, and as confirmed by science, children are efficient transmitters of coronaviruses.
There is no escape from the hard reality that we are way behind the rest of the “developed” world in vaccination: even Turkey and the USA are ahead of our most vaccinated jurisdiction, the ACT.
While wemight draw comfort from talk about our impressive vaccination progress, the focus of public policy should be on the so-far unvaccinated. They will be the source of serious cases that could overwhelm our hospitals; they will infect the small but significant number of people with weak immune systems with tragic consequences; they will drive daily infection numbers causing fear and apprehension in the community; their behaviour will determine whether we have to go into repeated regional or state-wide lockdowns.
The diagram below shows the percentage of Australians unvaccinated. It is constructed from the data in Covid19.com au – Vaccine targets and forecasts – but is essentially a mirror image. (That site’s data draws on official data up to the present day, and their projections use conventional mathematical models without any assumptions about policy or behavioural changes.)
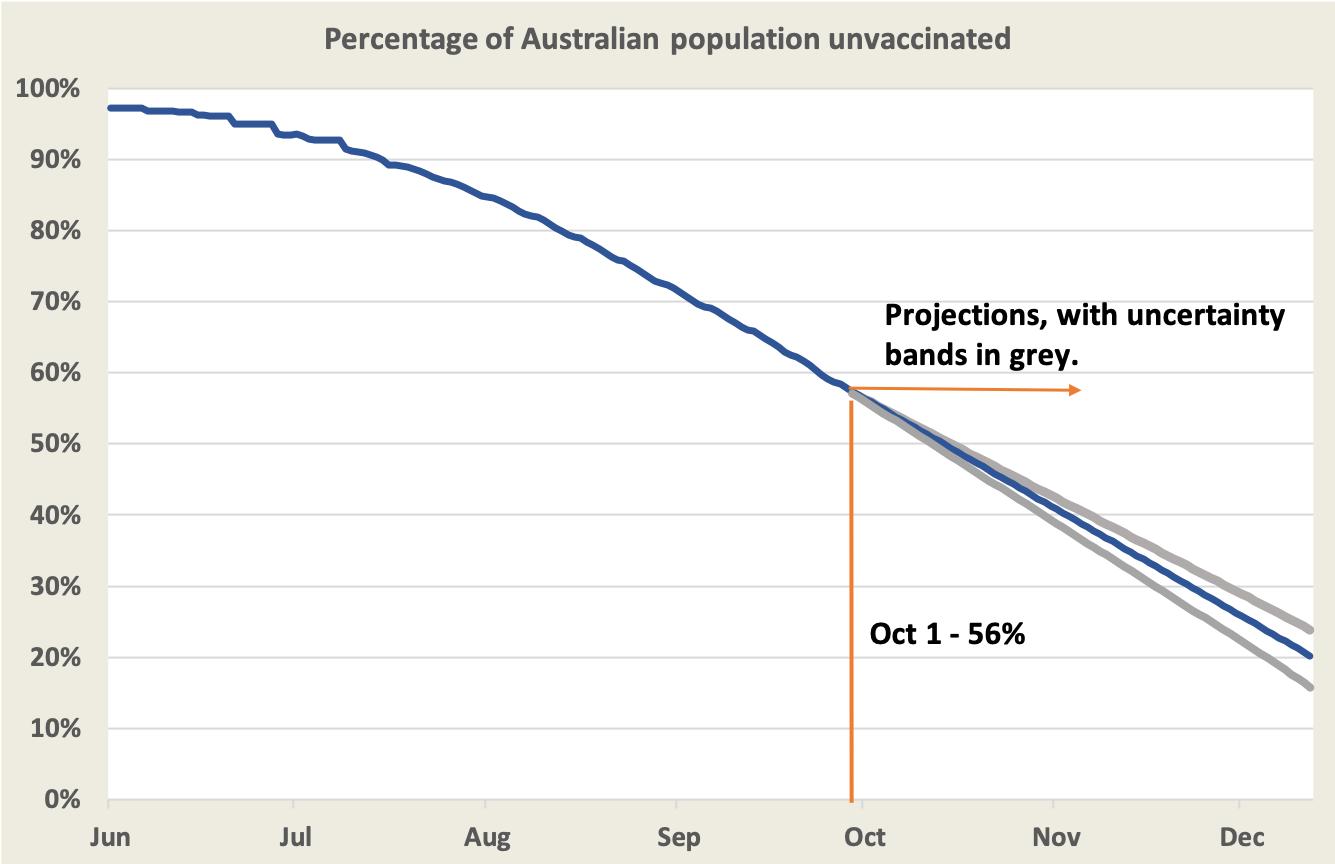
We have done well and there seems to be a momentum established, but we still have some way to go before we can reach a point where only 20 per cent of our population is unvaccinated. We may reach it by mid-December on present trends, or even earlier in New South Wales and the ACT, but the experience in other countries is that as we reach high levels of vaccination the task of reaching the unvaccinated becomes more and more difficult. Even if we reach those high levels of vaccination nationally, the pool of unvaccinated people won’t be scattered evenly throughout the community in some neat Gaussian distribution. There will be regional concentrations as there are in the USA; there will be certain groups suspicious of vaccination (although stories of “vaccination hesitancy” tend to be overblown to provide cover for incompetence by government and private agencies charged to distribute vaccines); there will be itinerants and others whose presence is hardly known to authorities; there will always be idiots with a complete disregard for public safety. Even the best models cannot deal with these variations. That is why Norman Swan believes that as we approach those high levels we will be able to rely less on the predictions generated by models and rely more on adjustments as we go.
That means we all need to be better-informed about the distribution of vaccination. The Commonwealth keeps us reasonably well-supplied with data on vaccination by state, age group and so on, but most of that data is in raw figures rather than in rates and at fairly high levels of aggregation. We need data at a more detailed level, and that task falls to other agencies. The New South Wales Government, for example, provides timely regional data on infections and vaccination . From such sources we know that the vaccination coverage in remote regions of Australia is particularly low.
As an example of such disaggregation, Inga Ting and her colleagues at the ABC’s Digital Story Innovation Team pull together data in relation to indigenous Australians. Nationally only 30 per cent of Aboriginal and Torres Strait Islanders aged 16 and older are fully vaccinated, and the situation is particularly bad in Western Australia where only 17 per cent of adult indigenous Australians are vaccinated. On ABC Breakfast Linda Burney, Shadow Minister for Indigenous Australians, explains what lies behind these figures . It’s not about “vaccination hesitancy”; rather the problem is a lack of political will and administrative incompetence. The much-publicised plans for 87 000 indigenous Australians over 55 to be fully vaccinated as “priority 1b” were nothing more than Morrison spin, and by now the gap is widening in every jurisdiction. (11 minutes.)
Vaccine effectiveness
On the ABC’s Coronacast Norman Swan draws attention to a UK study on the effectiveness over time of vaccines’ protection against contracting the virus: Are vaccines better at preventing infection than we thought? It is reasonably well-established that full (two dose) vaccination gives strong protection against severe disease and death, but the study to which he refers is about the effectiveness of vaccines in causing any infection. It’s an important distinction, because if vaccination can protect against infection, there is less likelihood of vaccinated people being out in the community unknowingly carrying and transmitting the virus. That has implications for public health measures: public health authorities may not need to worry so much about the movements of the vaccinated and direct their resources to the unvaccinated.
The same study also compared Pfizer and AstraZeneca vaccines for their capacity to sustain protection over time. It appears that Pfizer gives better short-term protection, but the protection given by AstraZeneca is more enduring: after a few months the Pfizer curve slips below the AstraZeneca curve.
Cases
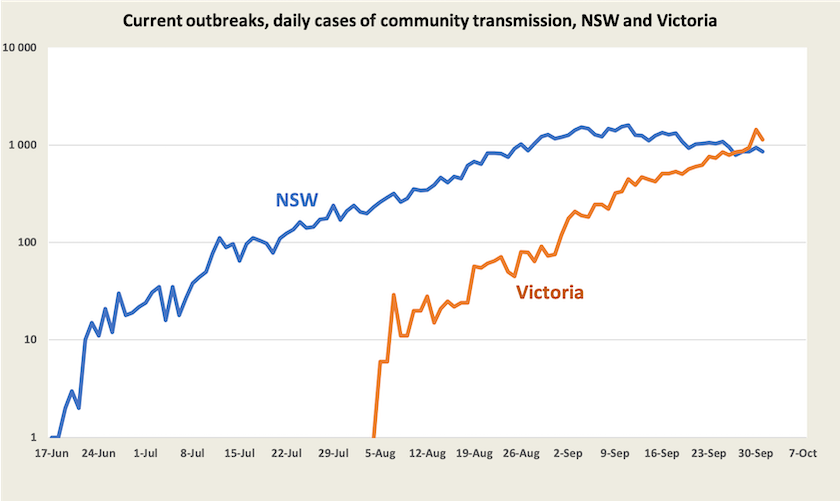
In New South Wales cases are on the way down, very slowly, suggesting a reproduction rate only a little below 1.0. By now public health experts are reasonably confident that rising vaccination levels are helping bend the curve. They are also expecting a significant rise in cases as public health and safety measures are lifted when those 70 and 80 per cent targets (of the 16+ population) are reached. Because there is such a rapid uptake of vaccination, possibly heading to 90 per cent of people 12 and over, Norman Swan is cautiously optimistic that the New South Wales health system will cope as the state opens up. But the situation is delicate: the Burnet and Doherty models both warn about a surge in hospitalisations and a runaway loop of positive feedback if opening up is too early.
Infections in Victoria have now overtaken infections in New South Wales, even though Victoria has a smaller population (6.6 million compared with 8.2 million). The New South Wales curve peaked in early September, when its vaccination coverage of the 16+ population was 43 per cent. Victoria’s is now 50 per cent and its case rate is still rising strongly. Victorian authorities are reasonably sure that the most recent jump in cases is associated with illegal house parties over last weekend, when there was a grand final game of one of the men’s football leagues.
Up to now Queensland has kept the virus at bay, but health experts warn that it is at a critical moment . Its vaccination level of the 16+ population is only 47 per cent. Although it has announced a range of public health and safety measures in response to a small number of unlinked cases it is still allowing a final game in another men’s football league to go ahead, with some minor distancing measures in the stadium.
In the ACT cases are averaging around 20 a day, with no sign of any trend. Although the numbers are small, around half are proving hard to link to known sources. Some combination of its strong lockdown and vaccination (about the same cover as New South Wales) is keeping the virus in check.
The world
About 33 per cent of the world’s population is fully vaccinated , while 46 per cent have received at least their first dose. Most of these vaccinations are in “developed” countries, including China. But the world story, however, is patchy: world averages are fairly meaningless.
The WHO Weekly Epidemiological Update shows a declining number of Covid-19 cases and deaths. These are subject to the qualifications we have mentioned in previous weeks.
Extraordinarily, the USA accounted for 26 per cent of last week’s recorded deaths from Covid-19. An article in The Economist – America’s pandemic is now an outlier in the rich world – goes into some detail about America’s high incidence of deaths, attributing it to a slowdown in vaccination, a culture of non-compliance with mask mandates among specific groups, and a high proportion of people who say they will never get vaccinated, particularly among those who voted for Trump last year. (Note that The Economist sits behind a paywall, but you can register to receive up to three articles a week.)
The scatter diagram below, an update of the same diagram from previous weeks, shows vaccination levels and recent death rates in high-income “developed” countries. The green markers are islands that have had strong border controls. In most European countries in this group vaccination rates are still growing, but slowly. Again we have left the US off: its vaccination level seems to be stuck at 67 per cent and its daily death rate of 6.2 per million would be off the scale.
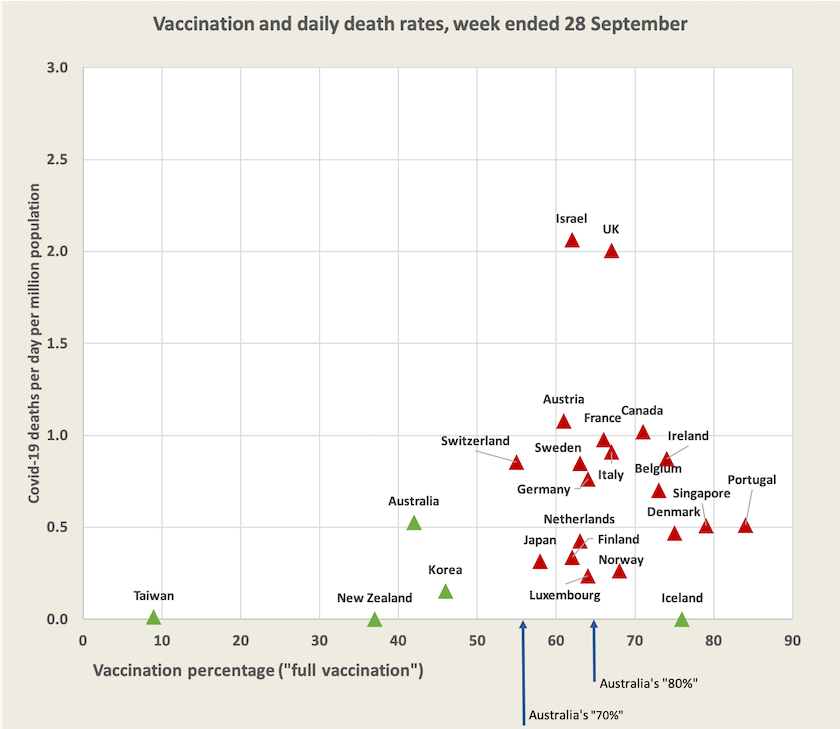
Within Europe Portugal is the standout country for vaccination, at 83 per cent of the population. Because children under 12 are not eligible for vaccination in Portugal, and because there is a 3 per cent core of hard vaccine resisters and people with certain medical conditions, the authorities believe that the limit (until children can be vaccinated) is 86 percent. Writing in the Financial Times – Portugal emerges as Europe’s vaccination frontrunner after public health drive – Lisbon-based journalist Peter Wise notes the country’s established focus on primary care and professional management of the rollout, but he identifies no outstanding factor. He also notes that Portugal has no official vaccine mandate. Deutsche Welle goes into a little more detail in a 12-minute YouTube clip on Portugal which mentions the political origins of its public health system. It’s not every day that Germans heap praise on southern European countries.
Norman Swan suggests we keep an eye on infections and deaths in Denmark and Norway, because these countries have been slowly opening up in the same staged process that is planned for Australia. So far in these countries infection rates have hardly moved, and Swan reports that in Denmark there has been no rise in hospitalisations: What can the world tell us about reopening? (10 minutes.)
Singapore, another highly-vaccinated country, has had a recent surge in cases – about 1700 a day in the last week: that’s in a city about the same size as Sydney. Singapore loosened restrictions on restaurants, bars and gyms in mid-August, but is now re-imposing them – with particularly harsh restrictions on foreign workers . Health authorities expect to see a surge in hospitalisation in coming weeks. Sydney Morning Herald’s south-east Asia correspondent Chris Barrett believes Singapore’s experiences carry a warning for us: Get beds ready now: Singapore’s reopening stumble a lesson for Australia .
The diagram shows a clustering of well-vaccinated countries with daily deaths between 0.5 and 1.0 per million. To put these figures in context, a daily rate of 0.5 per million would equate to about 5 000 deaths a year in Australia, and a daily rate of 1.0 per million to about 10 000 deaths a year. That compares with about 160 000 deaths from all causes each year. Covid-19 deaths stand out, however, because they are often preceded by a long period of high-resource hospitalisation, and because of the distress caused by necessary isolation.
Data sources
See the separate web page of hyperlinks to generally reliable information and analysis about Covid-19, including data on vaccination and the WHO Covid-19 epidemiological updates.